Flag Pattern

Flag Pattern

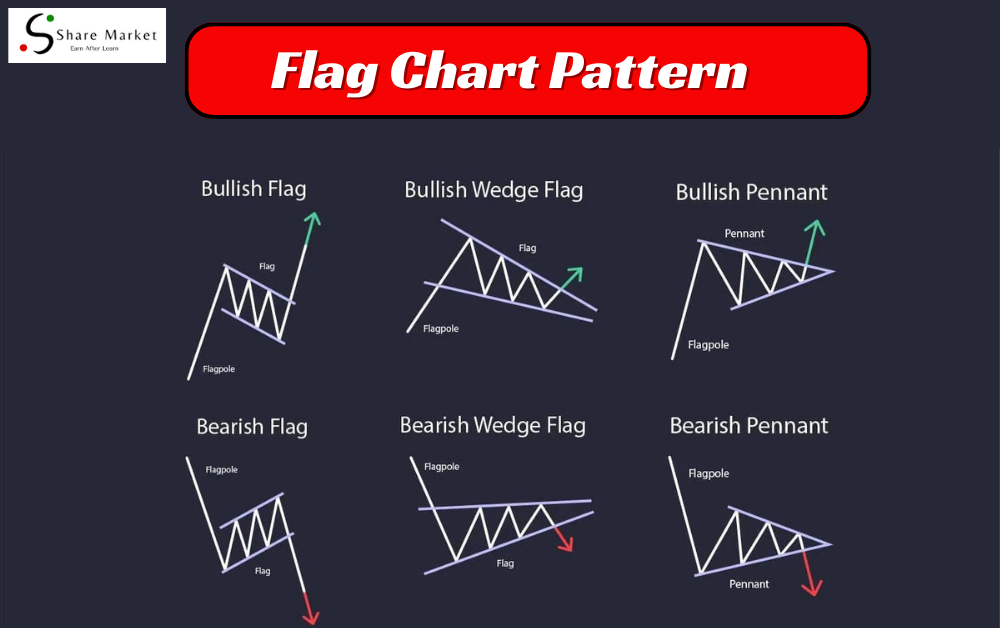
In trading, Flag Patterns act like clues for smart decisions. When you see a Flag Pattern, it’s like the market taking a quick breath before continuing its journey. Traders pay attention because it helps predict where prices might go next, making it a handy tool for successful trading.

M pattern Chart: Bearish Pattern

M pattern Chart

Welcome to the world of M Pattern Chart, a powerful analytical tool that has the potential to revolutionize the way we approach data analysis and decision-making. In this comprehensive guide, we will delve into the intricacies of M Pattern Chart, exploring its definition, applications, benefits, and dispelling common myths surrounding its use.

W Pattern in Trading: Double Bottom Pattern

w pattern in trading

The W pattern is a technical analysis pattern that resembles the letter ‘W.’ It is formed when the price of an asset creates two distinct troughs at roughly the same price level, creating a shape that resembles the letter W. This pattern is considered a reversal pattern, indicating a potential change in the trend.

Option Selling vs. Option Buying

n the dynamic world of options trading, understanding the nuances of option selling and option buying is crucial for making informed decisions. Each strategy has its merits and drawbacks, and the key is to align your trading approach with your risk tolerance and market outlook.

Inside Bar Candle Stick

Inside Bar Candle

An Inside Bar Candle is a candlestick pattern that forms when the high and low of the current candle are within the high and low of the previous candle. It represents a period of consolidation and indecision in the market, often signaling a potential breakout or reversal.

Muhurat Trading 2023

Muhurat Trading 2023

Muhurat Trading, also known as “Mahurat Trading,” is a special trading session that takes place on Diwali, the festival of lights. Investors eagerly await this auspicious occasion to engage in stock market activities and seek prosperity in their financial endeavors.