Inverted Head and Shoulders Pattern
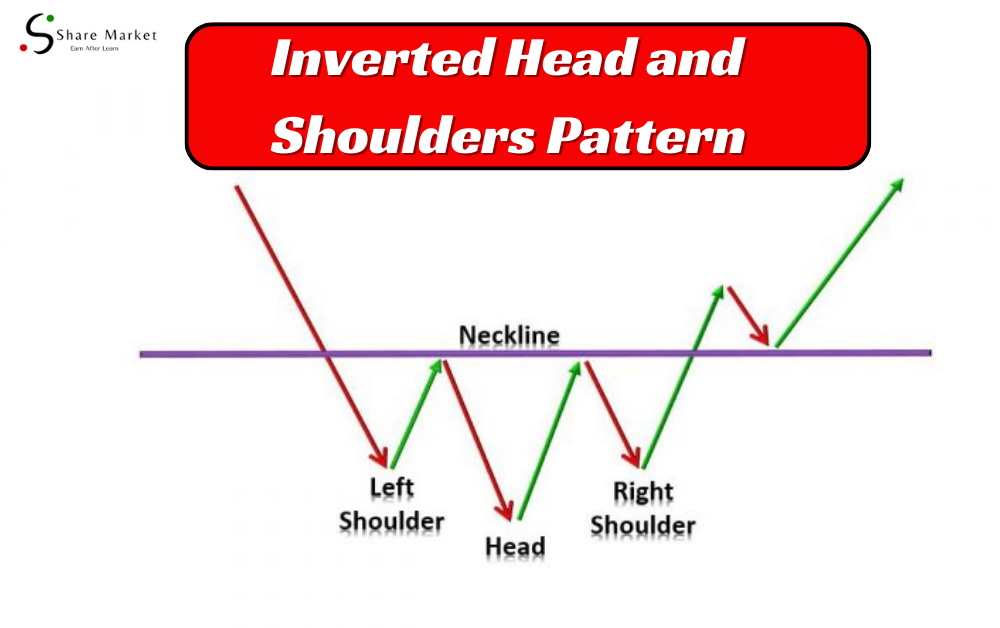
The Inverted Head and Shoulders pattern is a reversal pattern that typically forms after a downtrend. It consists of three troughs – a lower low (the head) between two higher lows (the shoulders).

The Inverted Head and Shoulders pattern is a reversal pattern that typically forms after a downtrend. It consists of three troughs – a lower low (the head) between two higher lows (the shoulders).
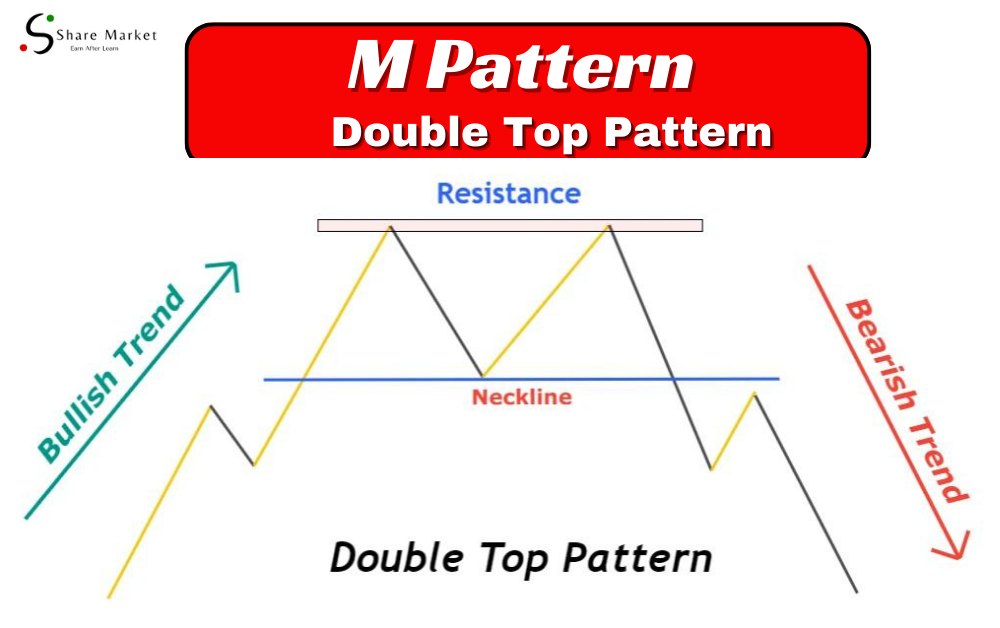
Welcome to the world of M Pattern Chart, a powerful analytical tool that has the potential to revolutionize the way we approach data analysis and decision-making. In this comprehensive guide, we will delve into the intricacies of M Pattern Chart, exploring its definition, applications, benefits, and dispelling common myths surrounding its use.

The W pattern is a technical analysis pattern that resembles the letter ‘W.’ It is formed when the price of an asset creates two distinct troughs at roughly the same price level, creating a shape that resembles the letter W. This pattern is considered a reversal pattern, indicating a potential change in the trend.

If you’re new to the world of stocks, do not worry! Buying stocks is simpler than it may seem, especially for beginners. In this guide, we’ll break it down step by step, ensuring you can take your first financial steps with ease and confidence.

Starting to trade means dealing with things like stocks, bonds, and options. Stocks mean you own a bit of a company, bonds are like loans you give, and options let you decide to buy or sell something at a set price.

An Inside Bar Candle is a candlestick pattern that forms when the high and low of the current candle are within the high and low of the previous candle. It represents a period of consolidation and indecision in the market, often signaling a potential breakout or reversal.
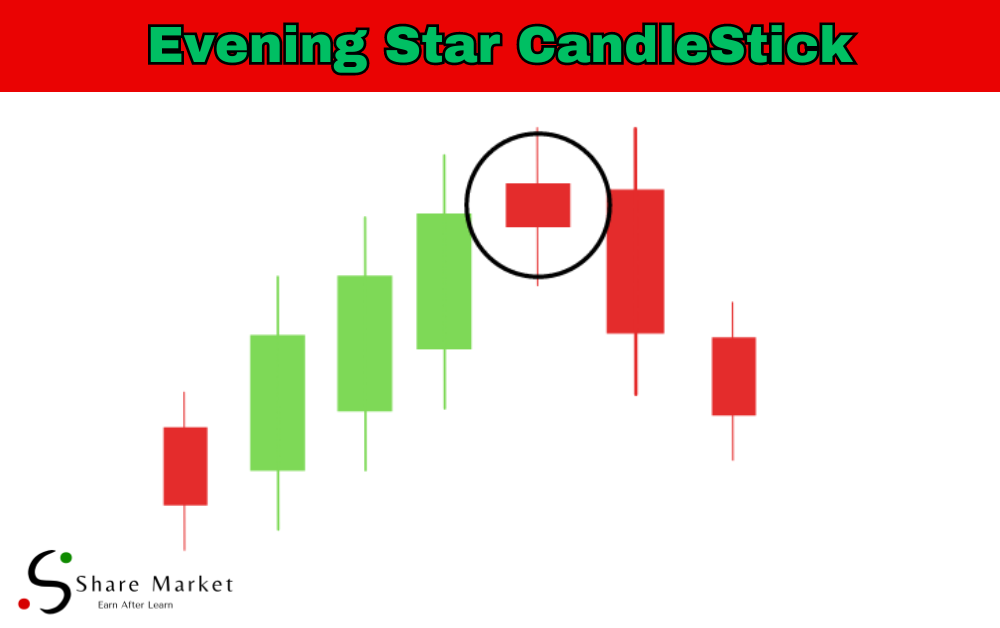
The Evening Star candle pattern is a powerful tool for traders seeking signs of a potential downturn in the market. Its distinctive formation provides a clear signal for those who know how to interpret it. Now, let’s delve into the details of this intriguing pattern.
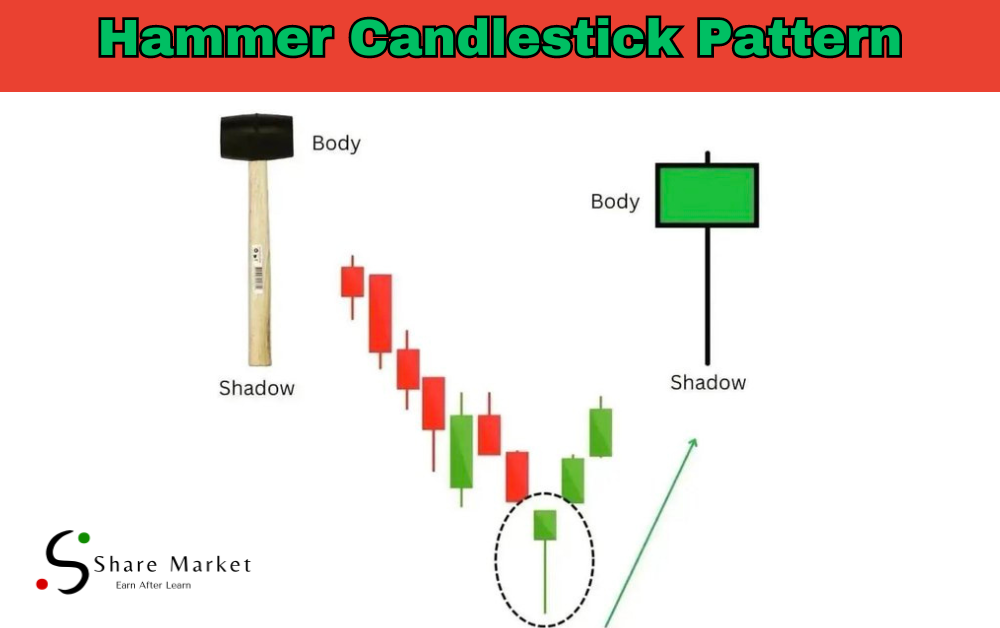
Introduction Welcome to the exciting world of stock trading, where mastering technical indicators can be the key to success. In this blog post, we’ll explore a powerful tool known as the “Hammer Candlestick Pattern.” Whether you’re a seasoned trader or just dipping your toes into the stock market, understanding this pattern can significantly enhance your … Read more

Introduction: Welcome to the world of stock trading! If you’re new to trading or looking to enhance your skills, understanding crucial patterns like Bearish Engulfing is essential. In this comprehensive guide, we’ll break down the Bearish Engulfing pattern, exploring its definition, significance, identification methods, trading strategies, and real-world examples. Definition of Bearish Engulfing: Bearish Engulfing … Read more
