
Table of Contents
1. Introduction: Bearish Harami Candlestick Pattern
The Bearish Harami Candlestick Pattern is a key candlestick pattern that can guide traders in understanding potential market reversals. In simple terms, it signals a possible shift from a bullish trend to a bearish one. Identifying this pattern is crucial for those venturing into the world of trading.
2. Identification of Bearish Harami Candlestick Pattern
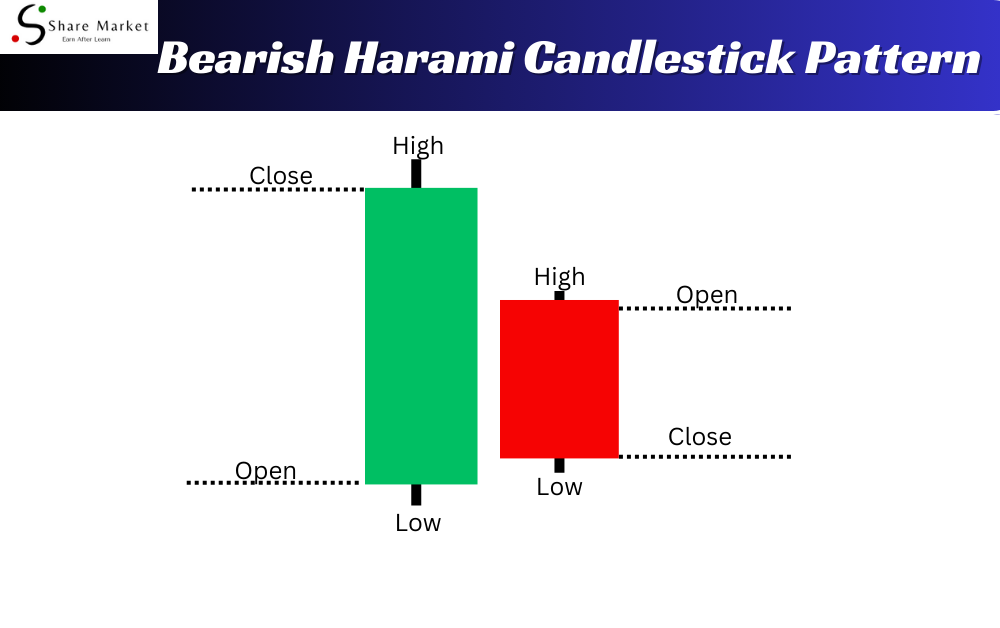
Recognizing the Bearish Harami Candlestick Pattern involves observing two consecutive candlesticks. The first candle is usually a large bullish one, indicating a strong upward movement. The second candle, however, is smaller and sits within the body of the first. This smaller candle suggests a possible weakening of the bullish momentum.
3. Components of Bearish Bearish Harami Candlestick Pattern
3.1. First Candle (Bullish):
This candle opens with a strong upward movement, reflecting the prevailing bullish sentiment. The size of this candle indicates the strength of the existing trend.
3.2. Second Candle (Bearish):
The second candle opens higher than the close of the first but then closes lower, creating a smaller body within the range of the first candle. This smaller size implies potential indecision or a shift in market sentiment.
4. How to Spot Bearish Harami
The Bearish Harami Candlestick pattern might sound complex, but spotting it is easier than you think! Here’s a simple guide to help you identify this pattern and make sense of it in real-life scenarios.
Step-by-Step Guide to Identifying Bearish Harami Candlestick Pattern:
Begin by looking at the previous candlestick, called the “mother candle.” This candle is usually large and bullish, indicating a positive market trend. Next, observe the current candle, known as the “inside candle,” which is smaller and nestled within the previous one. If the inside candle has a lower closing price than the previous candle’s opening price, you’ve found a Bearish Harami.
4.1. Real-life Examples for Clarity:
To make things crystal clear, we’ll explore real-life examples. Imagine a stock that has been rising (bullish) for some time. Suddenly, you notice a smaller candle fully contained within the larger one. This small candle’s lower close suggests a potential trend reversal.
4.2. Importance of Context in Pattern Recognition:
Context matters! Consider the overall market trend and other indicators. If the Bearish Harami appears after a prolonged uptrend, it might indicate a shift in market sentiment. However, in a downtrend, it could signal a continuation of the bearish trend. Always look at the bigger picture to confirm your observations.
Spotting Bearish Harami doesn’t have to be daunting. With this guide, you’ll soon be able to recognize this pattern and make more informed trading decisions. Stay tuned for Chapter 3, where we delve into the implications of Bearish Harami for traders.
5. Interpreting Bearish Harami Candlestick Pattern
Look How to interpret Bearish Harami patterns is crucial for traders looking to make informed decisions. When you spot a Bearish Harami on your candlestick chart, it’s like a red flag waving, suggesting a potential change in the market.
A Bearish Harami typically consists of two candles, where the first is a large bullish (upward) candle, followed by a smaller bearish (downward) candle completely engulfed within the body of the first. This pattern indicates a possible shift from bullish to bearish momentum.
Interpreting this pattern involves recognizing the change in sentiment. The large bullish candle shows previous strength, but the small bearish candle signals indecision or a struggle between buyers and sellers. It’s a potential sign that the bulls are losing control, and the bears might be gaining strength.
Keep in mind, though, that successful interpretation requires considering other factors like overall market trends and confirmation signals before making trading decisions.
6. Common Mistakes to Avoid**
When dealing with the Bearish Harami Candlestick Pattern, steering clear of common mistakes is crucial for successful trading. Here’s a brief look at three pitfalls to watch out for:
6.1. Overlooking Confirmation Signals:
One common blunder is disregarding confirmation signals. It’s like ignoring road signs while driving. Confirmation signals help validate the Bearish Harami pattern, providing a green light for potential trades. Failing to pay attention to these signals may lead to misguided decisions, akin to navigating without proper directions.
6.2. Ignoring Overall Market Trends:
Imagine trying to swim against a strong current—it’s challenging. Similarly, ignoring the overall market trends when dealing with Bearish Harami can be detrimental. Understanding the broader market direction is like going with the flow, enhancing the likelihood of successful trades and preventing potential losses.
6.3. Importance of Risk Management:
Just as wearing a helmet is essential for bike riding, implementing risk management is crucial in trading. Neglecting risk management while working with Bearish Harami could expose traders to unnecessary dangers. Setting stop-loss levels and managing risks wisely acts as a protective shield, ensuring a safer trading journey.
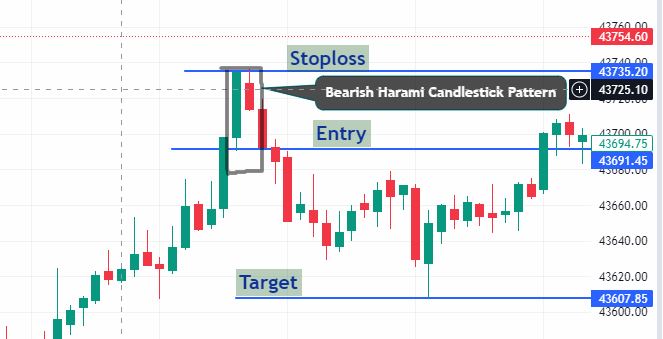
7. Trading Strategies with Bearish Harami
7.1. Incorporating Bearish Harami in Trading Plans
The Bearish Harami Candlestick Pattern can be a useful tool for traders when creating their trading plans. To incorporate this pattern effectively, traders should carefully observe its appearance on charts and use it as a signal for potential price reversals. By identifying a Bearish Harami, traders can make informed decisions about entering or exiting trades.
7.2. Setting Stop-Loss and Take-Profit Levels
When trading with the Bearish Harami, it’s crucial to manage risks and rewards. Setting stop-loss levels helps limit potential losses in case the market doesn’t move as expected. On the other hand, establishing take-profit levels allows traders to secure profits when the market behaves favorably. These levels should be determined based on factors such as the size of the pattern and the overall market conditions. The combination of incorporating Bearish Harami in trading plans and setting strategic stop-loss and take-profit levels empowers traders to make disciplined and calculated decisions, contributing to a more successful trading journey.
8. Real-world Examples
8.1. Analyzing Historical Charts with Bearish Harami
Explore real-life charts where the Bearish Harami candlestick pattern emerged. Witness how this pattern influenced market trends, providing valuable insights for traders.
8.2. Learning from Success and Failure Stories
Delve into stories of success and failure in trading with Bearish Harami. Understand how recognizing and acting upon this pattern contributed to profitable trades or helped avoid potential losses.
8.3. Gaining Confidence in Pattern Recognition
By studying actual cases, build your confidence in identifying Bearish Harami. Witnessing its impact in historical scenarios enhances your ability to spot this pattern in real-time, empowering you in your trading journey.
9. Conclusion
In conclusion, the Bearish Harami Candlestick Pattern is a key tool in trading. Remember, it shows a potential shift in market sentiment. To wrap up, let’s recap its main points: recognize the pattern, understand its implications, and consider it in your trading plan. Always keep learning about different patterns and stay curious. Trading safely is crucial, so use risk management strategies and don’t forget to follow the overall market trends. Happy trading, and may your financial journey be filled with continuous growth and success!
I hope that after reading this article, you have gained a lot of knowledge. If you want to learn more about trading, you can visit this website (www.sharemarketdo.com) and learn for free