
Table of Contents
Introduction Of Candlestick Pattern
Candlestick patterns play a crucial role in technical analysis, aiding traders in deciphering market trends and making informed decisions. One such pattern that often catches the eye of traders is the Tweezer Bottom. In this article, we’ll delve into the basics of the Tweezer Bottom candlestick pattern, its identification, significance, and how to avoid common mistakes when spotting it.
Basics of Tweezer Bottom Candlestick Pattern
Identifying This Pattern
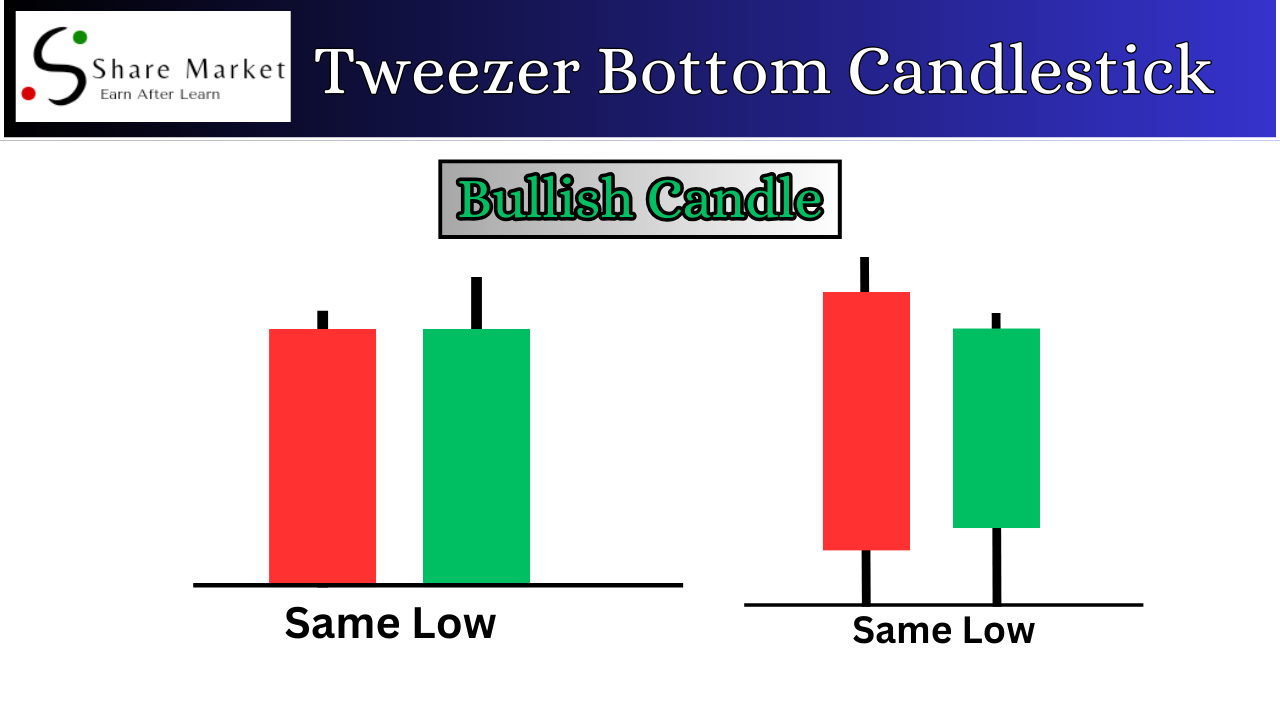
The Tweezer Bottom is a reversal pattern that forms after a downtrend, indicating a potential change in market sentiment. Identifying this pattern involves spotting two consecutive candles with almost identical lows, resembling a pair of tweezers.
What Does It Mean?
This pattern suggests a shift from bearish to bullish momentum. The identical lows signify that bears couldn’t push the price lower, hinting at a possible trend reversal.
Why Traders Care
Traders pay attention to This Pattern as they can signal the end of a downtrend and the beginning of an upward move. Recognizing these patterns at the right time can be a valuable tool in decision-making.
Keep in Mind
While Tweezer Bottoms are notable, they should be considered alongside other technical indicators for a comprehensive analysis.
Anatomy of This Candlestick Pattern:
First Candle
The first candle in this candlestick is typically bearish, reflecting the existing downtrend. This candle establishes a low point.
Second Candle:
The second candle is crucial – it’s bullish and opens at or near the previous candle’s close. The key is that it forms a low identical or very close to the low of the first candle, creating the tweezer-like appearance.
Key Takeaway:
The strength of the this candle lies in the equality of the lows, signifying a struggle between bulls and bears.
Interpreting Tweezer Bottom Signals:
The signals provided by This Candlestick Pattern is essential for effective use:
Reversal Signal:
The pattern suggests a potential trend reversal.
Support Confirmation:**
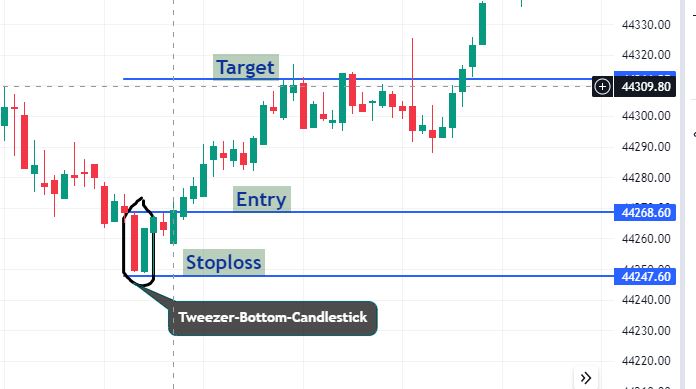
If the pattern occurs near a support level, it strengthens the reversal signal.
Heading this candlestick pattern in Action
To illustrate the effectiveness of Tweezer Bottoms, let’s consider a hypothetical scenario where the pattern forms after a prolonged downtrend. Traders might interpret this as a cue to enter long positions, anticipating a bullish reversal.
Common Mistakes to Avoid when Spotting This Candlestick Patterns
Ignoring Confirmation:
Relying solely on Tweezer Bottoms without confirming signals can be risky.
Overlooking Market Context:
Considering the broader market context is crucial for accurate analysis.
Being Impatient:
Waiting for confirmation rather than acting impulsively is key.
FAQs about Tweezer Bottom Candlestick Pattern
Q1: Can This Candlestick Pattern occur on longer timeframes?
A1: Yes, This Candlestick Pattern can be observed on various timeframes, from short-term to longer-term charts.
Q2: Are Tweezer Bottoms always followed by a bullish reversal?
A2: While This Candlestick Pattern indicate potential reversals, they should be considered alongside other factors for confirmation.
Conclusion
In conclusion, TB candlestick pattern serves as a valuable tool for traders, signaling potential trend reversals after a downtrend. However, it’s essential to approach it with a comprehensive strategy, considering confirmation signals and the broader market context. By understanding the basics, anatomy, and common mistakes associated with Tweezer Bottoms, traders can harness the power of this pattern for more informed decision-making in the dynamic world of financial markets.
I hope that after reading this article, you have gained a lot of knowledge. If you want to learn more about trading, you can visit this website (www.sharemarketdo.com) and learn for free.”