
Table of Contents
1. Basics of Tweezer Top Candlestick Pattern
The Tweezer Top Candlestick Pattern is a special pattern in the world of trading that can help us understand what might happen next in the stock market. Imagine looking at a price chart, and you see two candlesticks that look like twins, one after the other. That’s the Tweezer Top!
1.1. Identifying a Tweezer Top
– It happens after an uptrend, where the price goes up.
– The first candlestick is a green one (bullish), showing the upward movement.
– Right next to it is a red one (bearish), indicating the market might turn.
1.2. What Does It Mean?
– The Tweezer Top suggests a possible change in the trend. After a time of going up, it’s like a little warning sign that the prices might start going down.
1.3. Why Traders Care
– Traders pay attention because it can help them make better decisions. If they see a Tweezer Top, they might be cautious about buying more, thinking the market could go down.
1.4. Keep in Mind
– It’s not a guarantee. Sometimes the market doesn’t follow the Tweezer Top’s hint, but it’s still a useful signal.
2. Anatomy of a Tweezer Top: Understanding the Building Blocks
The Tweezer Top candlestick pattern consists of two candles that play a crucial role in signaling potential changes in market direction. Imagine these candles as storytellers of the market’s mood.
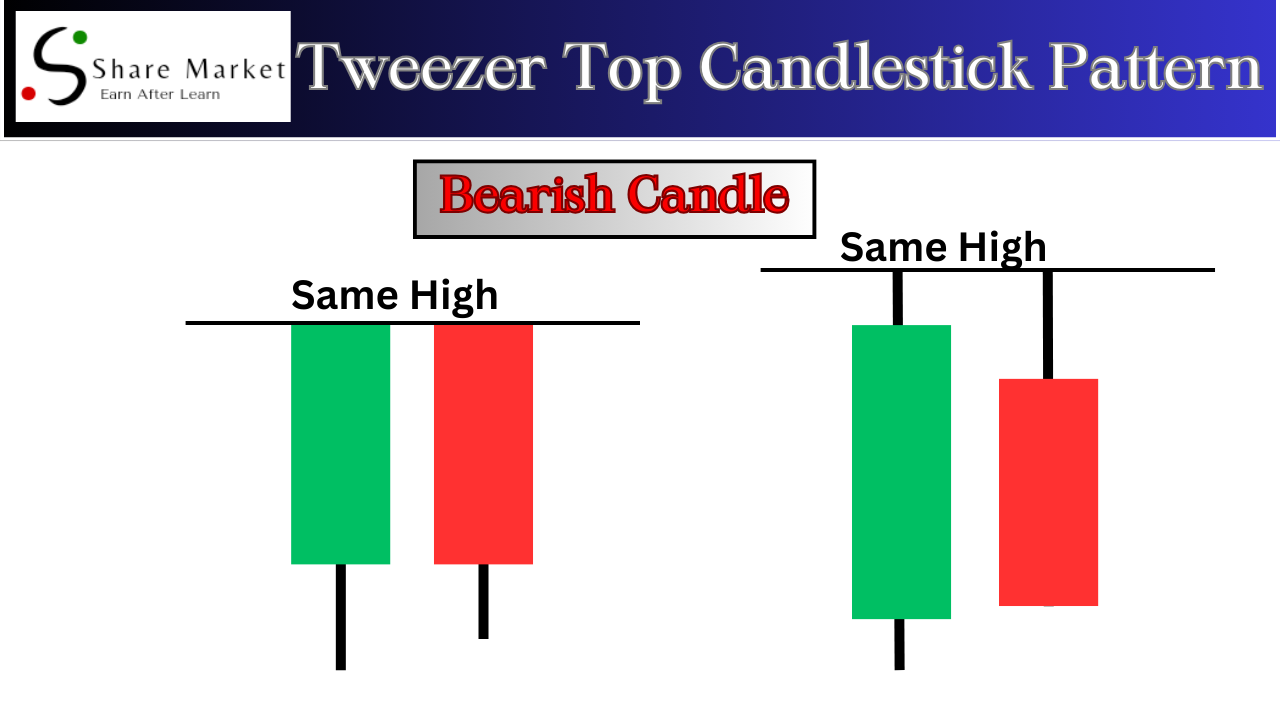
2.1. First Candle
This is usually a bullish (green) candle, indicating a positive trend. It sets the stage with optimism among buyers.
2.2. Second Candle:
Following the first, the second candle is bearish (red) and is nearly the same height as the first. It symbolizes a shift in sentiment, where sellers gain strength, challenging the previous optimism.
2.3. Key Takeaway:
The equality in height of these candles is like a tug-of-war between buyers and sellers. This tug-of-war suggests indecision in the market and could be a precursor to a potential reversal. Understanding the anatomy helps traders interpret the market’s emotional tug and make informed decisions.
3. Interpreting Tweezer Top Signals: Unveiling Market Sentiment
The Tweezer Top candlestick pattern provides crucial signals for traders deciphering market sentiment. When this pattern forms, it suggests a potential reversal in the ongoing trend.
3.1. Bullish Signals
If the Tweezer Top appears after a downtrend, signaling two candles with equal or nearly equal highs, it can indicate a potential bullish reversal. This suggests that the bears are losing control, and a shift in momentum might be underway.
3.2. Bearish Signals
Conversely, in an uptrend, a Tweezer Top can act as a bearish reversal signal. The identical or nearly identical high points of the candles imply a struggle between buyers and sellers, with potential for the bears to take charge.
4. Heading: Tweezer Top in Action
In real-life examples, the Tweezer Top candlestick pattern acts as a powerful indicator in financial markets. Imagine you see two consecutive candlesticks on a price chart—one with an upward spike and the next with a downward spike, forming a Tweezer Top. This pattern often marks a potential trend reversal. For instance, if the Tweezer Top appears after a prolonged uptrend, it suggests a potential shift to a downtrend. Traders keen on these visual cues use them to make informed decisions, helping them navigate market changes and make strategic moves in their trading activities.

5. Common Mistakes to Avoid when Spotting Tweezer Top Candlestick Patterns
One common mistake is misidentifying single candles as Tweezer Tops. Ensure you see two candles with similar highs. Also, avoid ignoring the overall trend; if the Tweezer Top appears in an uptrend, it’s more powerful. Another pitfall is neglecting confirmation signals; wait for the next candle to validate the pattern before making decisions. Lastly, don’t forget to consider the context—examining the broader market conditions and using additional indicators can help confirm the significance of the Tweezer Top. By avoiding these mistakes, traders enhance their accuracy in recognizing and leveraging Tweezer Top patterns effectively.
6. FAQs about Tweezer Top Candlestick Pattern
What is a Tweezer Top?
A Tweezer Top is a candlestick pattern with two candlesticks side by side, forming a peak. It indicates a potential reversal in the trend.
How do I identify a Tweezer Top?
Look for two candlesticks with almost equal highs. The first candle is usually bullish, followed by a bearish one.
What does a Tweezer Top signal?
It suggests a potential shift from upward to downward movement in the market. It’s a warning sign for traders.
Can Tweezer Tops be found in any market?
Yes, Tweezer Tops can appear in various financial markets, including stocks, forex, and commodities.
Is the Tweezer Top always reliable?
While it’s a powerful indicator, traders often combine it with other tools for more accurate predictions.
7. Conclusion
Discovering the Tweezer Top candlestick pattern opens doors to better trading decisions. Recognizing its signals can enhance your understanding of market movements. Take the time to master this simple yet powerful tool and watch your trading skills grow. Happy trading!
I hope that after reading this article, you have gained a lot of knowledge. If you want to learn more about trading, you can visit this website (www.sharemarketdo.com) and learn for free.