
Table of Contents
1. Introduction
1.1. Definition of Bullish Harami Candlestick Pattern
Picture the stock market like a storybook, and the Bullish Harami is a special chapter that tells us about potential good things ahead. In simple terms, a Bullish Harami is a two-candle pattern where a smaller candle stands inside the big shadow of the previous candle. It’s like a little one peeking out from a big friend’s shadow.
1.2. Why it Matters for Traders
Traders, which are like detectives in the stock market world, love the Bullish Harami because it often gives them clues about a plot twist. When this pattern shows up, it suggests that a falling trend might be taking a U-turn. It’s like a green light saying, “Hey, things might get better from here.”
Understanding Bullish Harami helps traders make smarter decisions. Imagine you’re playing a game, and suddenly you find a hidden map – that’s what Bullish Harami is for traders. It helps them navigate the market, giving hints about when it’s a good time to buy or sell. So, it’s not just a pattern; it’s like having a secret code in the stock market adventure.
2. Basics Of Bullish Harami Candlestick Pattern
2.1. Brief Overview of Candlestick Charts
Candlestick charts are like visual storytellers for traders. Each candlestick represents a specific time period, showing the opening, closing, high, and low prices. Picture it as a tiny rectangular box with lines sticking out – like a drawing of a candle!
2.2. Importance of Candlestick Patterns in Trading
Candlestick patterns, like the Bullish Harami, are crucial signals for traders. They reveal potential shifts in the market mood. Think of them as clues – when certain patterns appear, it’s like the market is dropping hints about what might happen next. It’s a language that, once understood, can guide traders in making smarter decisions.
3. Identifying Bullish Harami
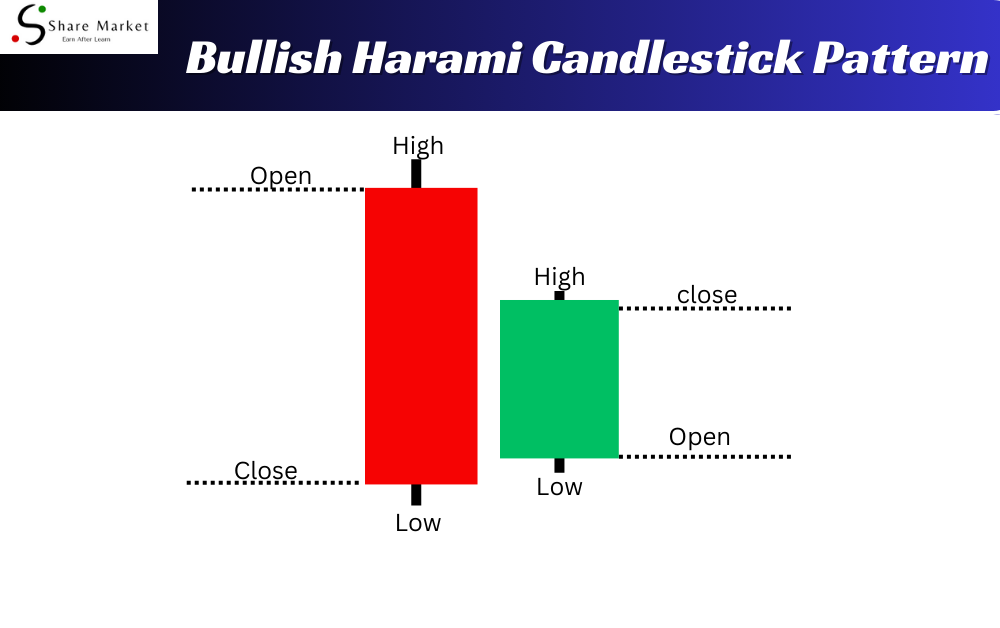
3.1. Description and Characteristics
Bullish Harami Candlestick Pattern is like a small happy surprise in the world of trading. It’s a two-candlestick pattern that suggests a potential change in the direction of the price. Imagine the first candle as a big friend (bearish candle) who is a bit gloomy, indicating a downtrend. Now, here comes the surprise – the second candle, the Bullish Harami, is a smaller one that appears inside the body of the first. It’s like a more optimistic friend saying, “Hey, things might turn around!”
3.2. Characteristics of the Bullish Harami Candlestick Pattern
A. Two Candles:
It involves only two candles – the first one showing a downtrend and the second, the Bullish Harami, fitting inside the first.
B. Size Matters:
The second candle is smaller, showing a possible weakening of the bearish trend.
C. Color Contrast:
The first candle is usually red (bearish), and the second is green (bullish).
3.3. Recognizing Patterns on a Chart:
To spot this friendly pattern on a chart:
A. Look for a Downtrend:
Find a series of red (bearish) candles indicating a downward movement.
B. Spot the Bullish Harami:
Search for a smaller green (bullish) candle that sits within the body of the previous red one.
C. Confirmation:
While it’s exciting, wait for the next candle to make sure the trend is changing.
In simple terms, Bullish Harami Candlestick Pattern is like a positive wink on the chart, suggesting that the gloominess might be replaced by brighter days in the trading world.
4. Interpreting Bullish Harami Candlestick Pattern Signals
4.1. What a Bullish Harami Candlestick Pattern Indicates:
A Bullish Harami signals a potential shift in the market. It occurs when a smaller bullish candle is neatly tucked within the previous larger bearish candle. This pattern suggests that the selling pressure might be losing strength.
4.1. Potential Market Reversals:
The Bullish Harami hints at a change from a bearish (falling) trend to a potential bullish (rising) trend. Traders often see this as an opportunity to consider buying, as it may indicate that the sellers are losing control, and the buyers could be gaining momentum. However, it’s essential to confirm this signal with other indicators for more reliable decision-making.
5. How to Spot Bullish Harami in Real Charts
Step-by-Step Guide for Beginners:
5.1. Look for a Previous Downtrend:**
– Identify a recent downtrend on the chart.
5.2. Locate a Bearish Candle:
– Find a large red candle in the downtrend.
5.3. Spot a Small Bullish Candle:
– Look for a smaller green candle next to the red one.
5.4. Confirm the Pattern:
– Ensure the small green candle is within the body of the preceding red one.
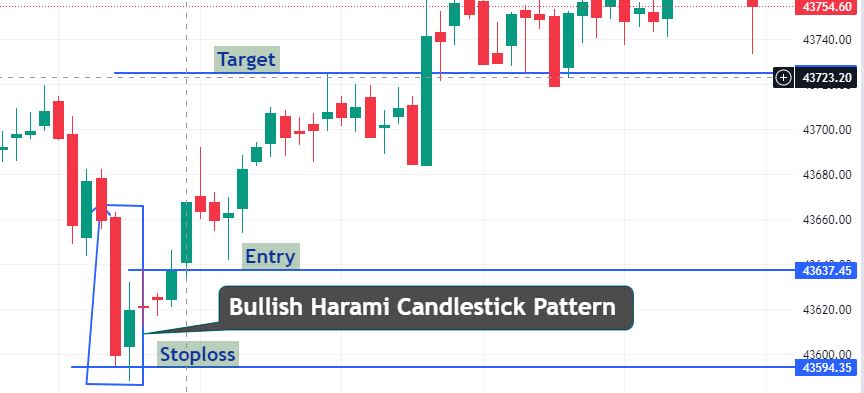
7. Trading Strategies with Bullish Harami
7.1. Entry Points:*
When you spot a Bullish Harami on your chart, consider entering a trade. Look for the smaller candle (the “baby”) inside the larger one. Start your trade at the opening of the candle after the Bullish Harami.
7.2. Exit Points:
Decide when to leave the trade. One option is to exit when the price goes up a certain amount or reaches a specific target. Another is to exit if a new candle suggests a reversal or change in trend.
7.3. Setting Stop Loss:
To limit potential losses, set a Stop Loss. This is a predetermined price level where your trade automatically closes if things don’t go as planned.
7.4. Take Profit Levels:
Determine a profit goal. When the price hits this target, your trade automatically closes, securing your gains.
9. FAQ
What is a Bullish Harami?
A Bullish Harami is a candlestick pattern signaling a potential trend reversal in trading. It consists of two candles: a large bearish one followed by a smaller bullish one inside its range.
How to Identify Bullish Harami?
Look for a big red candle followed by a smaller green one that’s completely within the red candle’s range. This suggests a shift from bearish to bullish sentiment.
What Does Bullish Harami Indicate?
Bullish Harami suggests a possible end to a downtrend, hinting at a bullish reversal. It’s a visual clue for traders to consider buying.
Is Bullish Harami Always Accurate?
While Bullish Harami can be reliable, it’s essential to confirm signals with other indicators for more confident trading decisions. Always consider market conditions and other factors.
8. Conclusion: the Power of Bullish Harami
Discovering the Bullish Harami pattern is like finding a golden key in the world of trading. In simple words, when you see this pattern, it might mean the winds are changing, and good times could be ahead. Remember, it’s not a crystal ball, but it’s a helpful signal. As a beginner, keep practicing, learn from experiences, and don’t rush. Bullish Harami is a friend, but like any friend, it’s good to understand it well. So, go ahead, explore, and may your trading journey be filled with green candles!
I hope that after reading this article, you have gained a lot of knowledge. If you want to learn more about trading, you can visit this website (www.sharemarketdo.com) and learn for free