Table of Contents
1. Introduction
Candlestick patterns have been a cornerstone of technical analysis for centuries, providing invaluable insights into market trends and potential price movements. In this comprehensive guide, we’ll unravel the complexities of candlestick patterns, exploring their fundamental elements, historical significance, and practical applications in trading. Whether you’re a novice trader or an experienced investor, understanding these patterns is essential for mastering the art of trading.
2. What Are Candlestick Patterns?
2.1 The Basics: Body, Wick, Color, and Direction
Candlestick patterns consist of key elements: the body (the rectangular area between the opening and closing prices), the wick (the thin lines above and below the body representing the price range), color (indicating bullish or bearish sentiment), and direction (upward or downward movement).
2.2 Types of Candlesticks: Bullish, Bearish, Neutral, Reversal, Continuation, etc.
Candlesticks come in various forms, each conveying specific market sentiments. From bullish patterns signaling upward price movements to bearish patterns indicating potential declines, understanding these types is crucial for predicting market behavior.
3. The Origins and Progression of Candle stick Charts
Delve into the rich history of candlestick charts, originating in Japan during the 18th century. Discover how these patterns evolved over time, becoming an integral part of technical analysis worldwide.
4. Benefits and Limitations of Using Candlestick
Explore the advantages of using candlestick patterns, such as their visual clarity and ease of interpretation. Acknowledge their limitations, including the need for confirmation signals and potential false positives, to make informed trading decisions.
5. Common and Powerful Candlestick
5.1 Hammer
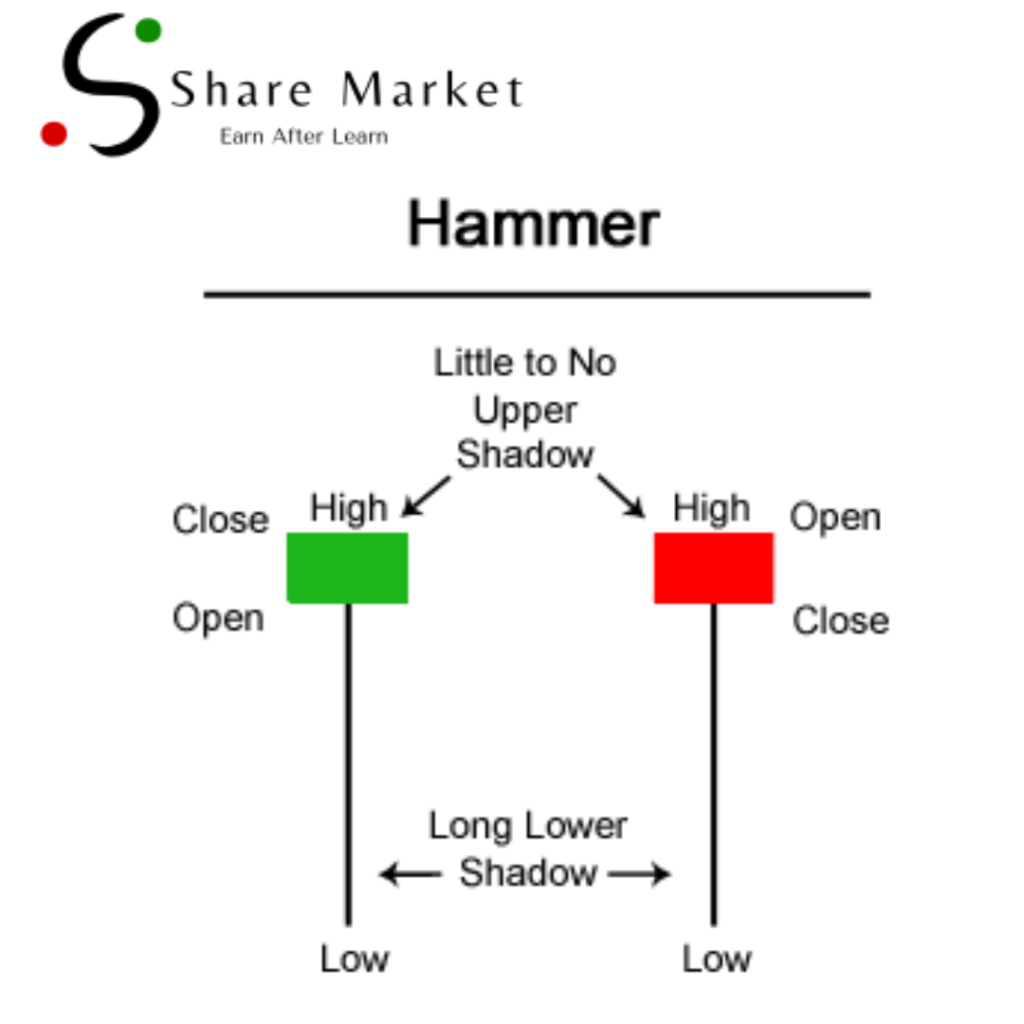
The hammer pattern, characterized by a small body and a long lower wick, suggests a potential bullish reversal after a downtrend.
5.2 Shooting Star
Conversely, the shooting star features a small body and a long upper wick, indicating a potential bearish reversal after an uptrend.

5.3 Engulfing
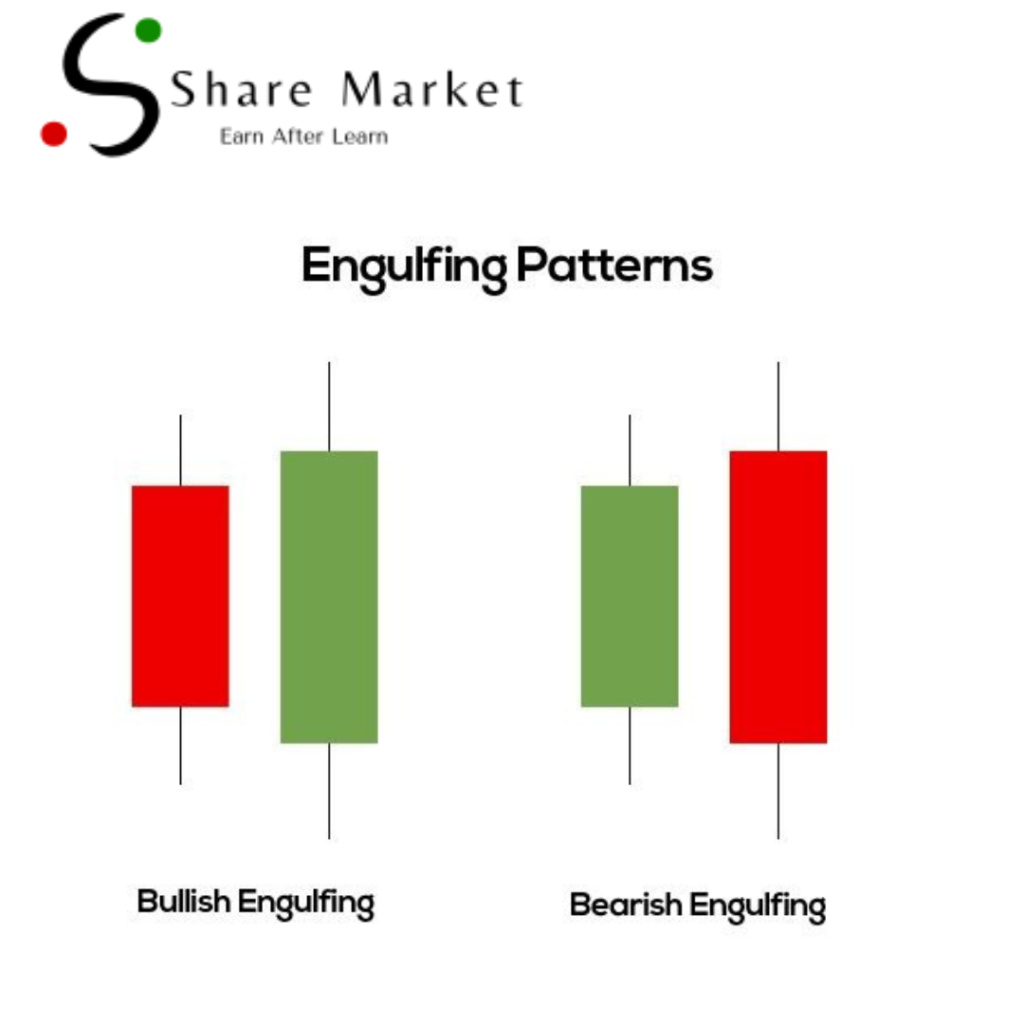
Engulfing patterns occur when one candle fully engulfs the preceding one, signaling potential reversals in market direction.
5.4 Doji
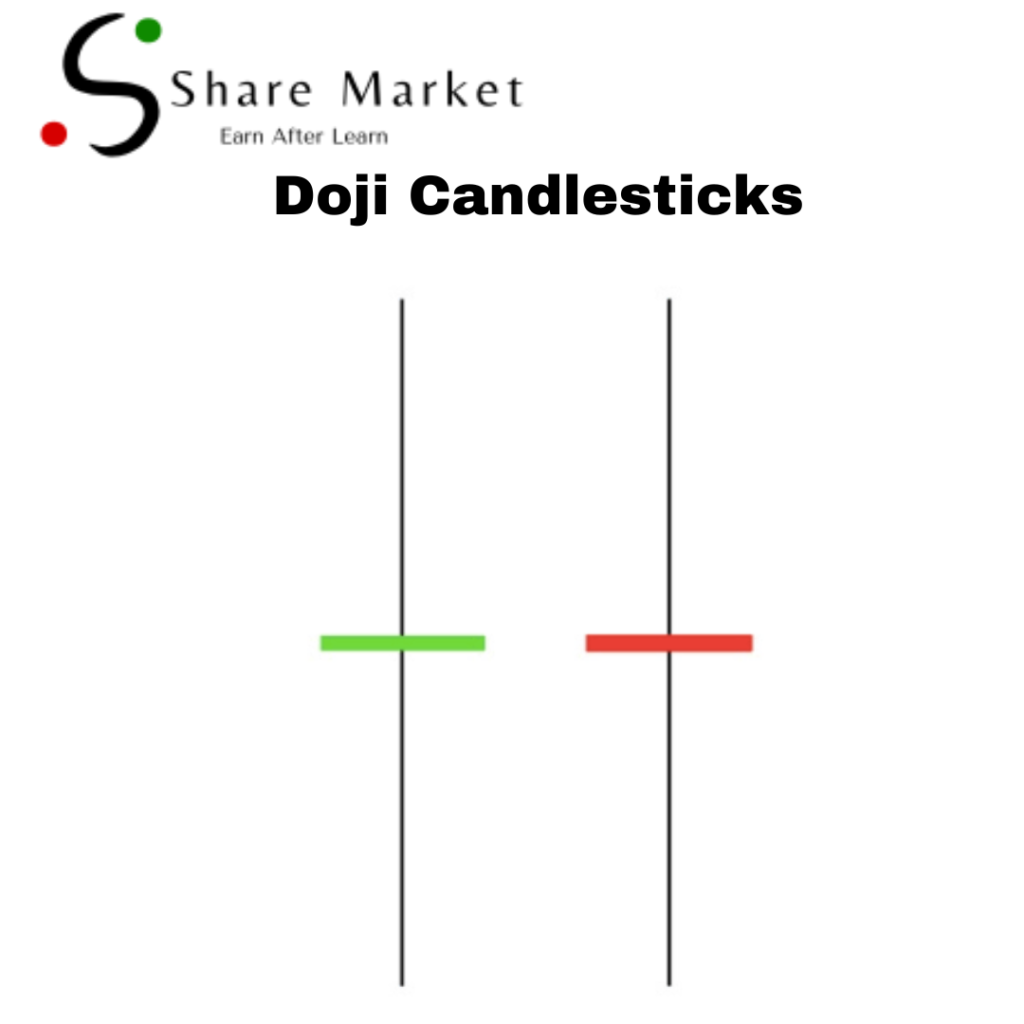
Doji candles, with equal opening and closing prices, signify market indecision and potential reversals, especially after significant price movements.
5.5 Morning Star and Evening Star
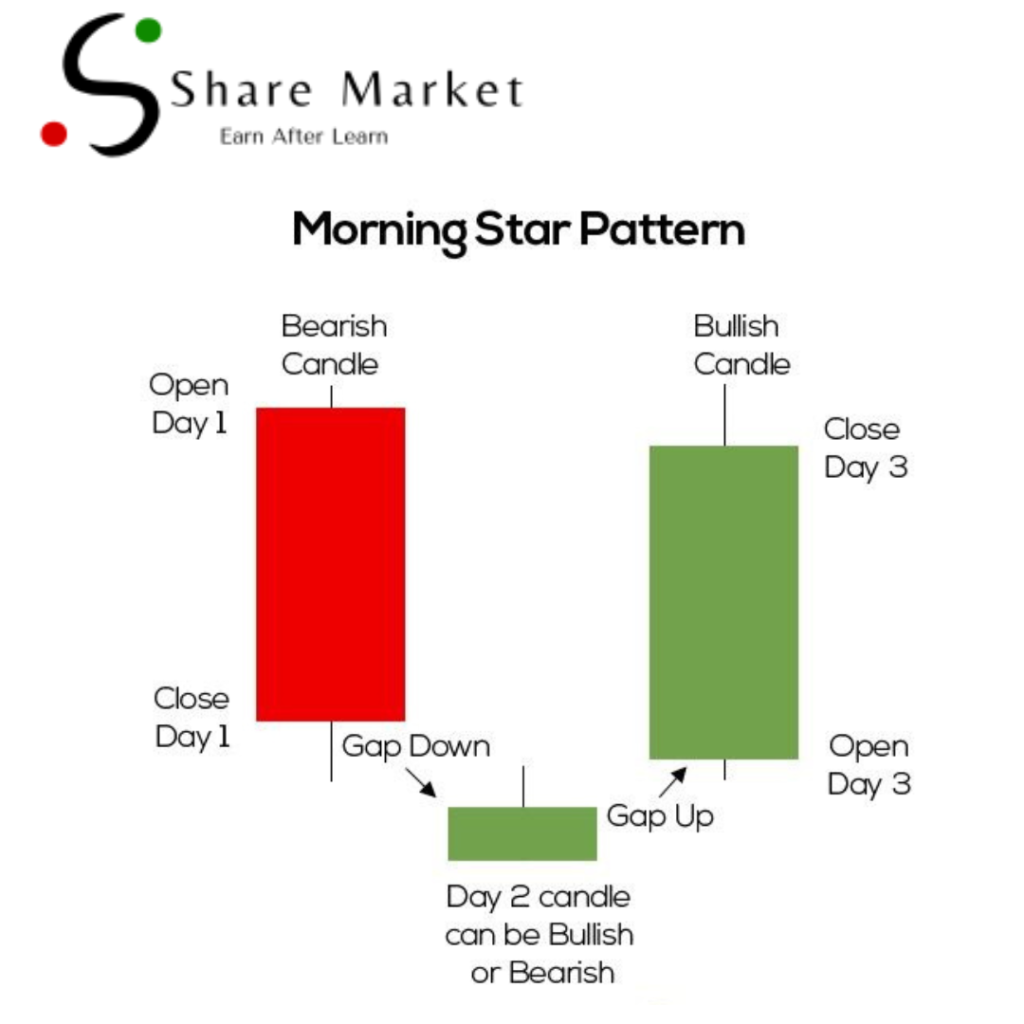
The Morning Star pattern consists of three candles – a bearish candle, a small-bodied candle indicating market indecision, and a bullish candle. This pattern suggests a potential bullish reversal. Conversely, the Evening Star pattern, with a bullish candle followed by a Doji or small-bodied candle and then a bearish candle, indicates a possible bearish reversal.
5.6. Harami Patterns
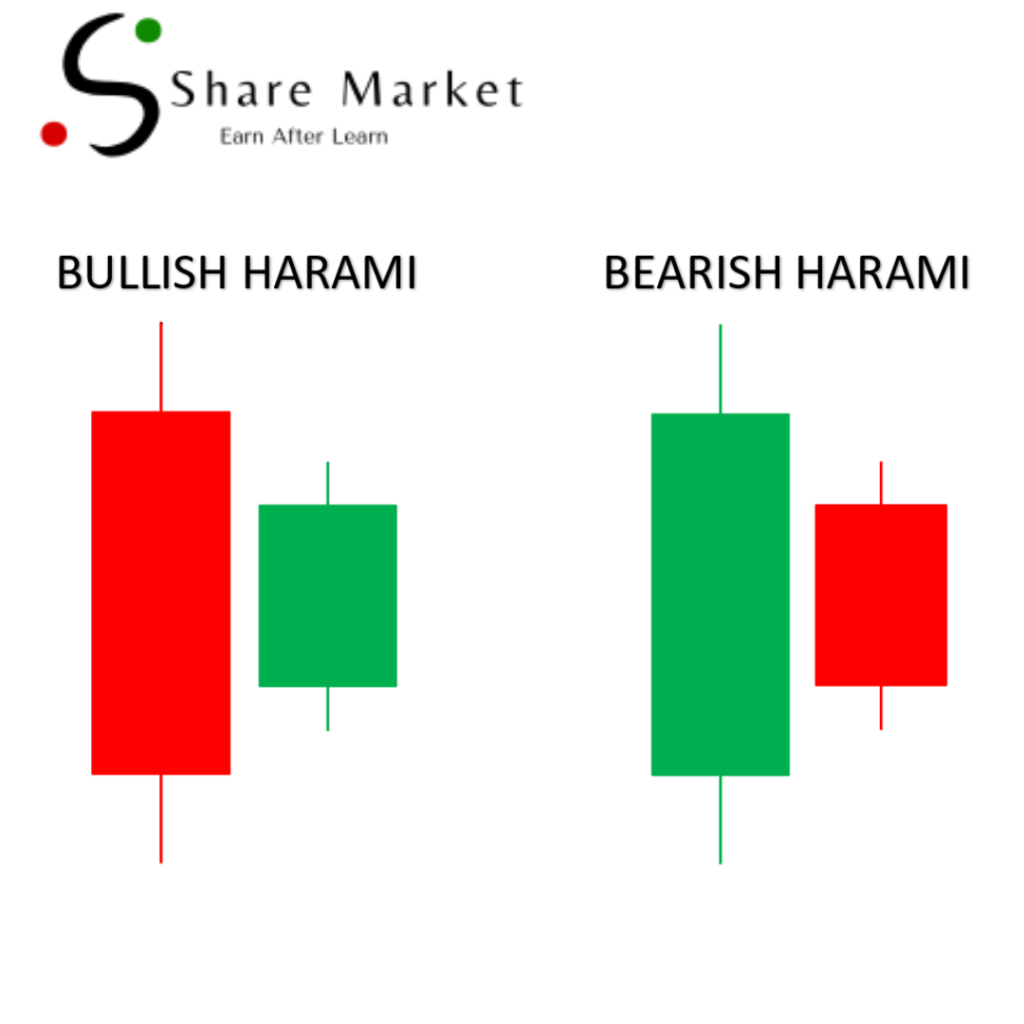
Harami patterns occur when a small-bodied candle is enclosed within the previous candle’s body. A bullish harami, where a small bullish candle appears within a larger bearish candle, signals a potential bullish reversal. Conversely, a bearish harami, with a small bearish candle within a larger bullish candle, indicates a potential bearish reversal.
5.7. Tweezer Tops and Bottoms
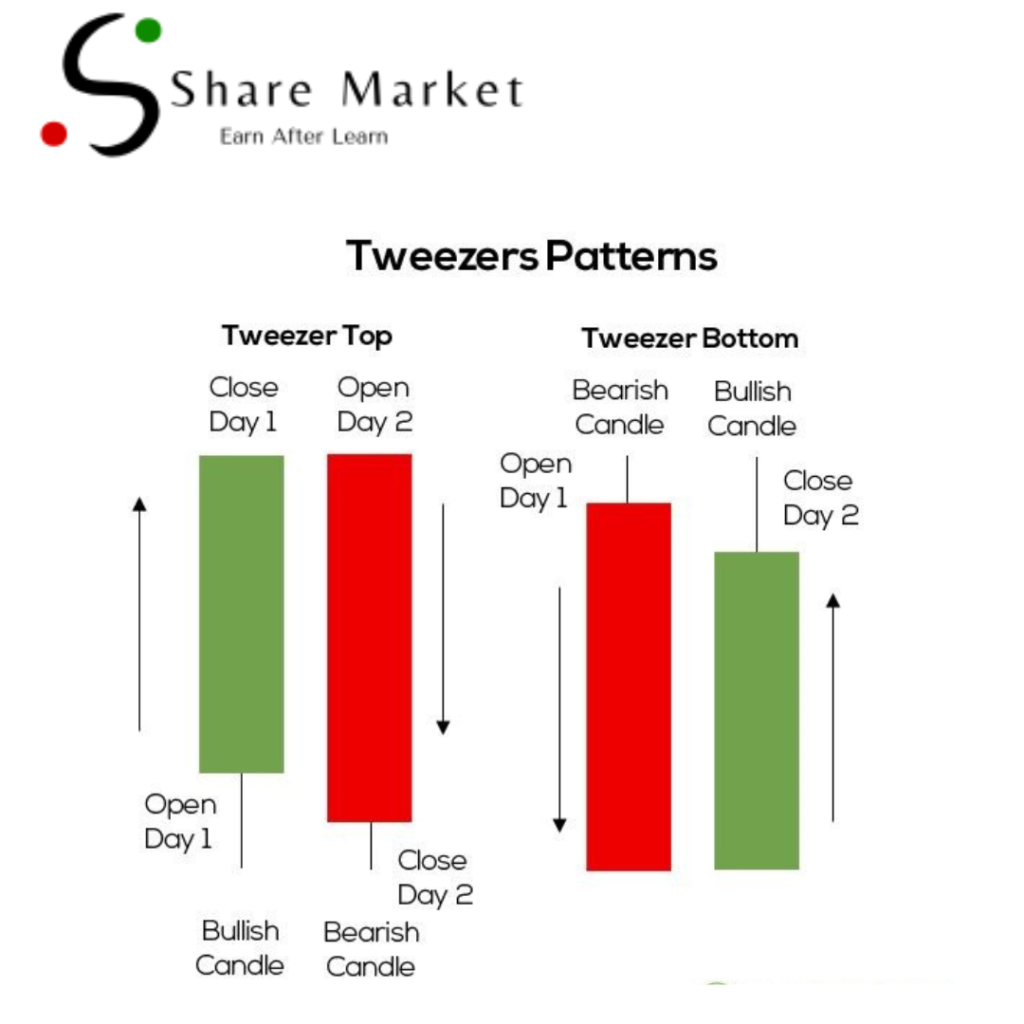
Tweezer Tops form when two candles have the same high, signaling a potential bearish reversal, especially after an uptrend. Tweezer Bottoms, with two candles sharing the same low, suggest a potential bullish reversal, particularly after a downtrend. These patterns highlight market indecision at crucial price levels.
5.8. Combining Candlestick Chart with Technical Indicators
To enhance the effectiveness of your trading strategies, consider integrating candlestick patterns with technical indicators like Moving Averages, Relative Strength Index (RSI), or Bollinger Bands. Combining these tools can provide comprehensive insights, confirming the signals given by candlestick patterns and increasing the probability of successful trades. there are more patterns to know.
6. Practical Interpretation: Charts, Examples, and Signaling
Dive into practical examples of candlestick patterns, illustrated through charts and real-world scenarios. Learn how to recognize these patterns and interpret their signals accurately.
7. Tips and Practical Advice for Successful Utilization.
Enhance your trading strategies by incorporating candlestick patterns with other technical indicators. Discover tips for identifying reliable patterns, setting appropriate entry and exit points, and managing risks effectively.
8. Conclusion
In summary, mastering candlestick patterns empowers traders with valuable insights into market dynamics. By understanding their nuances, historical context, and practical applications, you’re better equipped to navigate the complexities of trading. Remember, practice and continuous learning are essential. Apply your knowledge wisely, and let candlestick patterns guide you towards profitable trading endeavors.
9. Frequently Asked Questions (FAQs)
1. How can I effectively practice recognizing candlestick patterns?
Practicing with historical charts and utilizing trading simulators can help you hone your skills in identifying candlestick patterns.
2. Are candlestick patterns suitable for all types of markets?
Yes, candlestick patterns can be applied to various financial markets, including stocks, forex, cryptocurrencies, and commodities.
3. Should I only trust candlestick patterns when making trading choices?
While candlestick patterns provide valuable insights, it’s advisable to combine them with other technical indicators and conduct thorough analysis for well-informed trading decisions.
4. How can I differentiate between genuine candlestick patterns and false signals?
Confirmation signals, such as subsequent candle movements or volume analysis, can help validate candlestick patterns and reduce the likelihood of false signals.
5. Can candlestick patterns predict long-term market trends?
Candlestick patterns are more effective for short to medium-term predictions. For long-term trends, fundamental analysis should also be considered alongside technical analysis.Feel free to share your thoughts, ask questions, or share your experiences with candlestick patterns in the comments section below. Let’s continue the conversation and support each other in our trading endeavors!
6. How i learn treding?
To learn trading from basic go to www.sharemarketdo.com and learn trading from basic.

