
Table of Contents
Introduction
Welcome to the exciting world of stock trading, where mastering technical indicators can be the key to success. In this blog post, we’ll explore a powerful tool known as the “Hammer Candlestick Pattern.” Whether you’re a seasoned trader or just dipping your toes into the stock market, understanding this pattern can significantly enhance your trading strategies.
Understanding Candlestick Patterns
Before we dive into the specifics of the hammer candlestick pattern, let’s take a moment to grasp the broader concept of candlestick patterns themselves. These patterns are visual representations of price movements and are crucial for analyzing market behavior. Among them, the hammer pattern stands out for its unique characteristics and potential for traders.
Discover the Hammer Candlestick Pattern
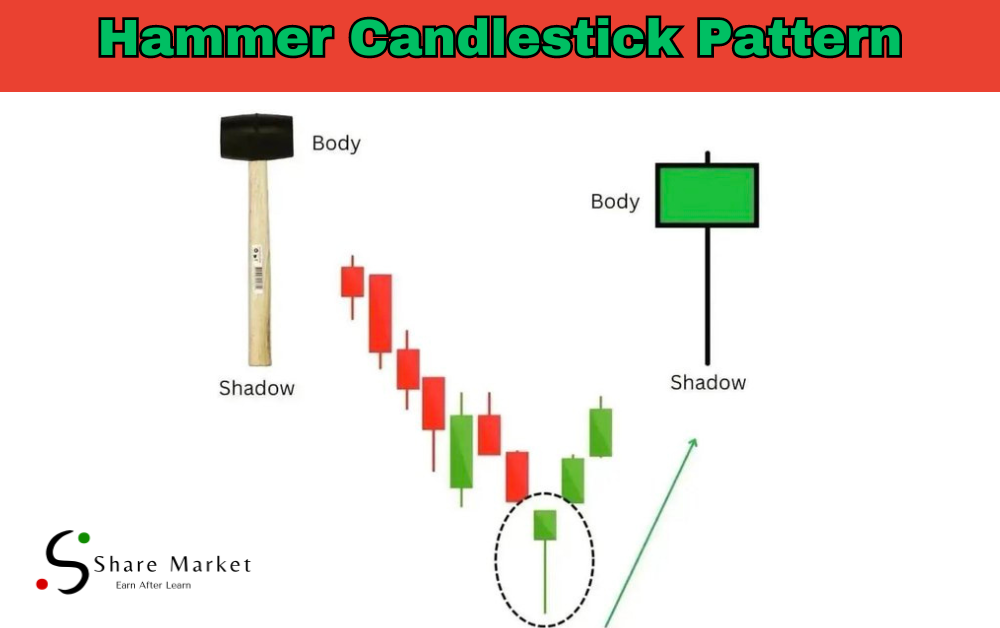
The hammer candlestick pattern is a bullish reversal pattern that emerges in the midst of a downtrend. It gets its name from its resemblance to a carpenter’s hammer, and for good reason—it can help traders “nail down” potential opportunities for trend reversals.
Significance of the Hammer Candlestick Pattern
The hammer pattern is highly significant due to its ability to signal a potential reversal in a bearish trend. This pattern tells us that despite a downward trend, buyers have stepped in to drive prices back up. It’s a ray of hope for traders during challenging times.
Decoding the Hammer Candlestick
Now, let’s dig deeper into the hammer candlestick pattern.
Definition and Anatomy
The hammer pattern is defined by:
– A small real body near the top of the candlestick.
– A long lower shadow, at least twice the length of the real body.
– Little to no upper shadow.
These elements together form the characteristic shape of a hammer.
Identifying the Hammer
Recognizing the hammer pattern involves keeping an eye out for the specific elements mentioned above. When you spot these features in a candlestick, you’re likely looking at a hammer.
Formation of the Hammer
Hammer patterns typically form after a period of bearish trading. The market opens lower, leading to a substantial decline. However, as the session progresses, buyers enter the market and push the price back up, resulting in a small real body near the high of the candlestick. Lets watch the video to understand the candle in detail.
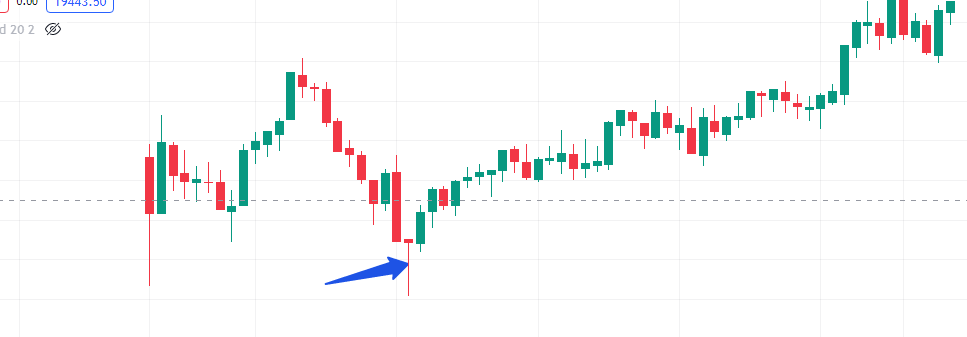
Real-life Examples
Let’s take a closer look at some real-life examples to solidify your understanding:
Using the Hammer for Profitable Trades
Now that you can identify the hammer pattern, it’s time to explore how to make the most of it in your trading endeavors.
Trading Strategies
1. Bullish Reversal Signal: When the hammer pattern appears after a downtrend, it serves as a signal for potential bullish reversal. Traders often use this as an opportunity to go long or buy the asset.
2. Confirmation Signals: For added confidence, some traders wait for a higher close in the next session to confirm the bullish potential of the hammer pattern.
3. Risk Management: Always set a stop-loss level, typically just below the low of the hammer candlestick, to manage potential losses.
Limitations and Risks
While the hammer pattern is a valuable tool, it’s important to understand its limitations:
– False Signals: No trading indicator is foolproof, and the hammer pattern can sometimes produce false signals. It’s essential to use other tools and indicators for confirmation.
– Market Conditions: The reliability of the hammer pattern can vary depending on market conditions, such as low liquidity or high volatility.
Tips for Successful Trading
To maximize the effectiveness of the hammer pattern, consider these tips:
– Combine the hammer pattern with other technical indicators to strengthen your analysis.
– Practice risk management by setting stop-loss orders to protect your capital.
– Improve your pattern recognition skills by studying historical charts and practicing identifying hammer patterns.
– Stay informed about market news and external factors that can influence your trading decisions.
Frequently Asked Questions (FAQs)
Q1: Hammer vs. Inverted Hammer
The key difference is their occurrence and implications. The hammer pattern appears after a downtrend, signaling a potential bullish reversal, while the inverted hammer appears after an uptrend, suggesting a bearish reversal.
Q2: The Importance of the Long Lower Shadow
The long lower shadow in the hammer pattern signifies that sellers pushed the price lower during the trading session, but buyers managed to bring it back up, indicating a potential trend reversal.
Q3: Confirmation Signals
A confirmation signal for the hammer pattern often involves a higher close in the next trading session, indicating that bullish sentiment is continuing.
Q4: Setting an Effective Stop-Loss
A common approach is to set the stop-loss just below the low of the hammer candlestick. This level is used to limit potential losses in case the pattern fails to deliver the expected reversal.
Conclusion
In the ever-changing landscape of stock trading, the hammer candlestick pattern is a beacon of hope for traders seeking potential reversals in bearish trends. By mastering its identification, understanding its significance, and employing it alongside other technical tools, you can enhance your trading performance. Remember that while the hammer pattern is a valuable asset, no trading indicator is infallible. Risk management remains paramount in the world of trading. With continuous learning and practice, you can build your expertise and make more informed decisions in the dynamic stock market. So, go ahead, nail down those trading opportunities with the power of the hammer candlestick pattern!
I hope this article proved helpful for you. If you want to read more similar articles or learn about the stock market, you can visit this website (www.sharemarketdo.com).