Table of Contents
—
Introduction
In the complex world of trading, understanding patterns and signals is crucial. One such powerful tool used by traders is candlestick charts. These charts provide valuable insights into market trends and investor sentiment, making them an essential part of any trader’s toolkit. Among the multitude of candlestick patterns, the Morning Star Candlestick stands out as a beacon of hope for traders, signaling potential trend reversals. In this comprehensive guide, we will unravel the mysteries behind the Morning Star Candlestick pattern, guiding you through its definition, components, interpretation, and practical application in trading.
—
Understanding Candlestick Charts
Before diving into the specifics of the Morning Star pattern, let’s grasp the basics of candlestick charts. Candlestick charts are visual representations of price movements in the financial markets. They consist of individual candles that convey the opening, closing, high, and low prices for a specific time period, providing traders with a holistic view of market activity.
—
A Brief History of Candlestick Charts
Originating in Japan in the 18th century, candlestick charts have stood the test of time. Introduced by Japanese rice trader Munehisa Homma, these charts gained widespread popularity due to their effectiveness in predicting price movements. Over the years, candlestick patterns, including the Morning Star, have become indispensable tools for traders worldwide.
—
Explaining the Morning Star Candlestick
Definition of the Morning Star Candlestick:
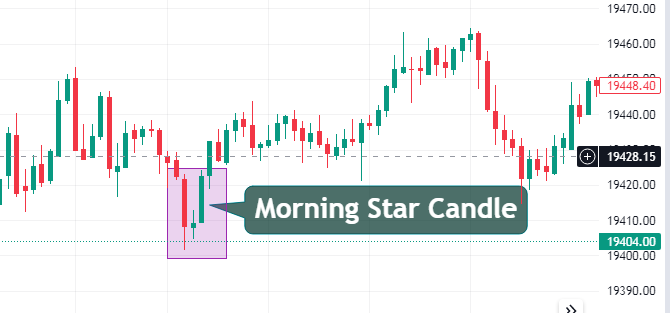
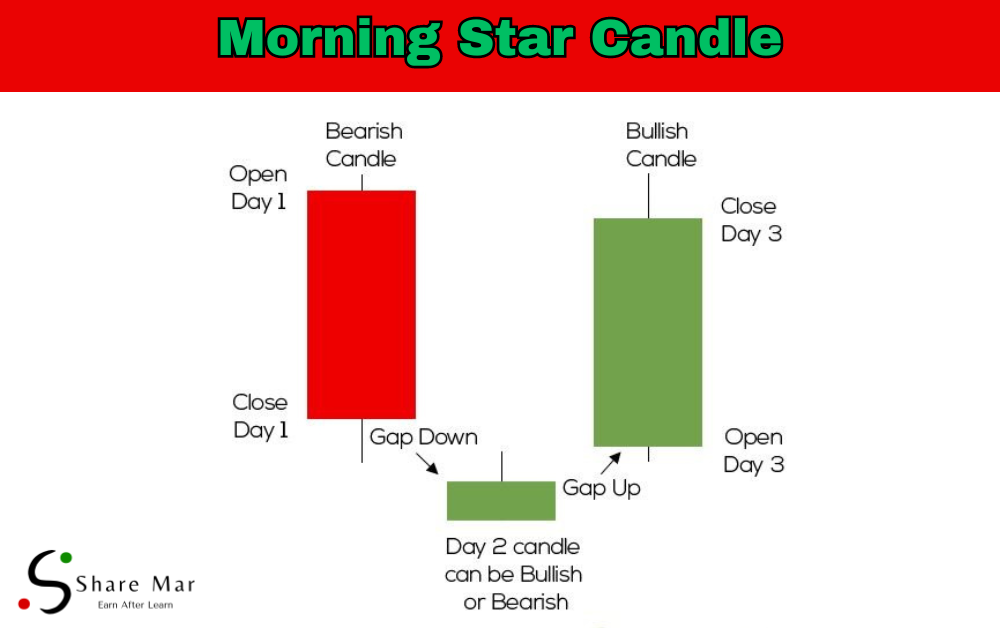
The Morning Star pattern is a bullish reversal pattern that typically appears at the end of a downtrend. It consists of three candles: a large bearish candle, followed by a small candle with a short body, and finally, a large bullish candle. This pattern signifies a potential shift from bearish to bullish market sentiment. here is the live example of morning star candlestick pattern

Components of the Morning Star Pattern:
1. First Candle: A large bearish candle indicating a downtrend.
2. Second Candle: A small candle with a short body, representing market indecision.
3. Third Candle: A large bullish candle, signaling a potential trend reversal.

Reading the Morning Star Candlestick
Identifying the Pattern:
To identify the Morning Star pattern, look for the following criteria:
1. The first candle should be bearish.
2. The second candle should have a small body, indicating market indecision.
3. The third candle should be bullish and close above the midpoint of the first candle.
Interpreting the Pattern:
The Morning Star pattern suggests that bears are losing control, and bullish momentum is building. Traders often view this pattern as a signal to enter long positions or close out existing short positions, anticipating an upcoming uptrend.
Utilizing Candlestick Analysis in Trading
How to Use Candlestick Analysis in Trading:
Candlestick analysis is a versatile tool used by traders to identify trends, reversals, and entry/exit points. By combining the Morning Star pattern with other technical indicators, traders can make well-informed decisions, enhancing their trading strategies.
Regulated Brokers Offering Charting Tools:
For traders seeking reliable charting tools, several regulated brokers provide advanced platforms with comprehensive candlestick analysis features. Some reputable options include [List of regulated brokers].
—
Further Reading
For those eager to delve deeper into the world of candlestick patterns and trading strategies, here are some additional resources worth exploring:
To learn about how to trade at morning star candle then click here
Frequently Asked Questions (FAQs)
Q: What is the Morning Star Candlestick pattern?
A: The Morning Star Candlestick pattern is a bullish reversal pattern consisting of three candles: a large bearish candle, a small indecisive candle, and a large bullish candle. It indicates a potential shift from a downtrend to an uptrend.
Q: How do I identify the Morning Star Candlestick pattern?
A: To identify the Morning Star pattern, look for a bearish candle followed by a small indecisive candle and then a bullish candle closing above the midpoint of the first candle.
Q: What does the Morning Star Candlestick pattern indicate?
A: The Morning Star pattern suggests a weakening bearish trend and the possibility of a bullish reversal. It indicates that buyers are gaining strength, potentially leading to an uptrend.
Q: What is the difference between the Morning Star and Evening Star Candlestick patterns?
A: While the Morning Star is a bullish reversal pattern, the Evening Star is its bearish counterpart. The Evening Star pattern signals a potential shift from an uptrend to a downtrend and consists of a bullish candle, followed by a small indecisive candle, and then a bearish candle.
Q: How can I use the Morning Star Candlestick pattern in trading?
A: Traders can use the Morning Star pattern as a signal to enter long positions or exit existing short positions. It is essential to confirm the pattern with other technical indicators and market analysis for higher accuracy in trading decisions.
—
Conclusion
Mastering candlestick patterns like the Morning Star is a valuable skill for any trader. With its ability to forecast potential trend reversals, this pattern empowers traders to make informed decisions in the dynamic world of financial markets. By understanding the nuances of the Morning Star Candlestick and incorporating it into comprehensive trading strategies, investors can navigate the markets with confidence, seizing opportunities and mitigating risks along the way. Remember, practice and continuous learning are the keys to becoming a successful trader, so keep honing your skills and exploring the diverse facets of technical analysis.
“I hope you’ve learned a lot from this blog. If you want to continue learning, visit www.sharemarketdo.com. There, you can learn about the stock market in detail. Keep learning!”

