

Table of Contents
Introduction of The Shooting Star Candlestick Pattern
In the world of stock trading and technical analysis, the use of candlestick patterns is a common practice. These patterns can help traders make informed decisions by providing insights into market sentiment and potential price movements. One such pattern that holds significance is the “Shooting Star Candlestick.” In this article, we will explore the shooting star candlestick pattern in detail, from its characteristics to its interpretation and trading strategies.
What Is The Shooting Star Candlestick Pattern?
The shooting star is a specific type of candlestick pattern that can provide valuable information to traders. To identify a shooting star, you need to look for the following characteristics:
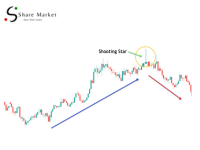
– Appearance: The shooting star is characterized by a small real body near the low of the day. It has a long upper shadow and little to no lower shadow. Visually, it resembles a candle with a small body and a long wick pointing upwards.
– Timing: Shooting stars typically appear after an uptrend in the market. They are considered bearish reversal patterns, indicating a potential shift in the price trend.
Key Characteristics of a Shooting Star
To better understand the shooting star candlestick pattern, let’s delve into its key characteristics:
1. Formation during a price advance: Shooting stars occur when the market has been in an uptrend. This means that buyers have been in control, pushing prices higher. The appearance of a shooting star suggests that the trend may be weakening.
2. Upper shadow significantly larger than the body: The most distinctive feature of a shooting star is the long upper shadow. This shadow represents the price level at which the market opened during the trading session and the highest price reached during the session. The length of the upper shadow should be noticeably longer than the body of the candlestick.
3. Little to no shadow below the real body: Unlike the upper shadow, the lower shadow of a shooting star is either very small or non-existent. This absence of a lower shadow indicates that the price didn’t move far below the opening level during the trading session.
4. Signaling a potential price reversal: The shooting star is a bearish candlestick pattern, and it suggests that the balance of power between buyers and sellers is shifting. It signifies that sellers have entered the market and pushed the price lower, despite the initial attempts by buyers to drive prices higher.
Interpreting the Shooting Star
Understanding the shooting star candlestick pattern is one thing, but interpreting it correctly is crucial for traders. Here’s what the shooting star tells us:
– Buyers initially pushed the price higher during the trading session, causing the market to open and reach a higher price.
– However, as the session progressed, sellers gained control and pushed the price down. This is represented by the long upper shadow of the candle.
– The long upper shadow indicates that buyers were in a losing position by the end of the session.
It’s important to note that the significance of aThe Shooting Star Candlestick Pattern is often confirmed by the behavior of the next candlestick that forms in the chart. If the following candlestick reinforces the bearish sentiment by showing a price decline, it adds credibility to the shooting star’s potential as a reversal signal.
Trading Strategies of The Shooting Star Candlestick Pattern
Traders often use the shooting star pattern as a basis for their trading strategies. Here are two common approaches:
1. Selling or shorting: When a shooting star forms after an uptrend and is followed by a bearish candle, it can be a signal to sell or short the asset. This implies that traders anticipate a price reversal and aim to profit from a declining market.
2. Watching for resistance: In some cases, a shooting star may not immediately lead to a price drop. Traders can also use it as a signal to watch for potential resistance levels around the range of the shooting star. If the price approaches this range again and shows signs of resistance, it can be an opportunity for traders to enter short positions or take profits.
Examples and Chart Analysis
Let’s explore a couple of visual examples to understand how the shooting star pattern looks on a stock chart and how it can be identified in real-world trading scenarios.
**Example 1:**
In this example, you can see a shooting star forming after a significant uptrend. The long upper shadow is evident, and the small real body is located near the low of the day. Subsequently, the next candlestick confirms the shooting star’s bearish signal by experiencing a price decline.
**Example 2:**

Here, another shooting star pattern is observed. After the uptrend, the shooting star appears, and once again, the next candlestick shows a bearish sentiment as the price declines.
These examples illustrate how shooting stars can manifest in real trading situations and how they may be interpreted by traders.
Limitations and False Signals
While the shooting star is a valuable tool in technical analysis, it’s important to acknowledge its limitations and the possibility of false signals. Some factors to consider include:
– **Market context**: The shooting star should be analyzed within the broader context of the market. It’s essential to consider other technical indicators and market fundamentals before making trading decisions.
– **Confirmation**: A single shooting star, while a potential warning, should ideally be confirmed by other technical signals or patterns for greater reliability.
– **False signals**: Not every shooting star leads to a significant price reversal. In some cases, the market may continue its uptrend or consolidate rather than reversing.
– **Timeframes**: The effectiveness of the shooting star can vary depending on the timeframe being analyzed. It may be more reliable on longer timeframes compared to shorter ones.
Conclusion
In conclusion, the shooting star candlestick pattern is a powerful tool in the arsenal of technical traders. It provides insights into potential bearish reversals in the market, especially after uptrends. However, it should be used in conjunction with other technical analysis tools and considered in the broader context of market conditions.
By understanding the key characteristics of The Shooting Star Candlestick Patternand how to interpret them, traders can make more informed decisions when buying or selling assets. Remember that like any trading strategy, the shooting star pattern has its limitations and may not always lead to the expected outcome. Risk management and continuous learning are essential for successful trading.
Incorporating the shooting star pattern into your analysis can be a valuable addition to your trading toolkit, helping you navigate the complexities of the financial markets with greater confidence.
Frequently Asked Questions (FAQ)
**Q1: Can The Shooting Star Candlestick Pattern occur on any financial chart, or is it specific to certain assets?**
A1: The shooting star pattern can appear on various financial charts, including stocks, forex, commodities, and more The shooting star pattern can be found on various types of assets and is not exclusive to a particular asset category.
**Q2: Are there any other candlestick patterns that work well in conjunction with the shooting star pattern?**
A2: Yes, several candlestick patterns can complement the shooting star. For example, the bearish engulfing pattern or the dark cloud cover pattern can reinforce the bearish sentiment signaled by a shooting star.
Certainly, let’s continue:
**Q3: How can I distinguish between a shooting star and a similar-looking candlestick pattern, such as a doji?**
A3: Distinguishing between a shooting star and a doji can be essential for accurate analysis. While both patterns have small real bodies, there are key differences. In a shooting star, the upper shadow is significantly longer than the body, and there is little to no lower shadow. In contrast, a doji has an equally sized upper and lower shadow with a small body in the middle, indicating market indecision. Paying close attention to the length of the upper shadow relative to the body will help you tell them apart.
**Q4: How should I incorporate The Shooting Star Candlestick Patterninto my trading strategy?**
A4: Integrating The Shooting Star Candlestick Pattern into your trading strategy involves a two-step process. First, use it as a potential signal for a bearish reversal after an uptrend. If the next candle confirms the bearish sentiment, you can consider entering short positions or taking profits on existing long positions. Second, monitor the price action around the range of the shooting star as it may act as a resistance level Traders can utilize this knowledge to choose the right moments to enter or exit their trades.
**Q5: Can The Shooting Star Candlestick Pattern be used for day trading or is it more effective on longer timeframes?**
A5: The effectiveness of The Shooting Star Candlestick Pattern can vary depending on the timeframe you are trading. While it can be used for day trading, it may be more reliable on longer timeframes, such as daily or weekly charts. Shorter timeframes can be more volatile and prone to false signals, so it’s essential to use the pattern in conjunction with other technical indicators and confirmations.
**Q6: Are there any software tools or trading platforms that automatically identify The Shooting Star Candlestick Pattern?**
A6: Many trading platforms and technical analysis software offer features that can automatically identify candlestick patterns, including shooting stars. These tools use algorithms to scan charts and highlight potential patterns. However, it’s crucial to verify the accuracy of these automated identifications and not solely rely on them. Manual confirmation and analysis are still essential for making informed trading decisions.
**Q7: What is the historical performance of the shooting star pattern in predicting price reversals?**
A7: The historical performance of the shooting star pattern in predicting price reversals varies based on market conditions and timeframes. While it can be a reliable signal, it is not infallible, and traders should always consider it in the broader context of market analysis Relying solely on past performance is not a dependable way to make trading decisions. Incorporating the shooting star pattern into your trading strategy can enhance your ability to identify potential trend reversals and make more informed trading decisions. Remember that, like any trading tool, it should be used with caution and in combination with other analysis methods to reduce the risk associated with trading in financial markets. The shooting star pattern can be a valuable asset in your trading toolkit, but it’s important to remain adaptable and continuously learn and refine your approach as market conditions evolve.
i think the above article are benificial for you if you want to learn more about candle stick pattern then go to www.sharemarketdo.com