
Table of Contents
1. Introduction:
Welcome to the fascinating world of trading patterns! In this blog post, we’ll dive into the intricacies of a specific pattern that traders often keep a close eye on – the Bearish Flag Pattern. Whether you’re a seasoned trader or just starting, understanding this pattern can provide valuable insights into market movements.
2. Definition of Bearish Flag Pattern:
The Bearish Flag Pattern is a technical analysis tool used in trading to identify potential downward price continuation. It is considered a bearish signal, suggesting that a prevailing downtrend is likely to resume after a brief consolidation period.
3. Brief History of Bearish Flag Chart Pattern:
The concept of flag patterns dates back to the early days of technical analysis. Traders have long sought ways to predict market movements, and the bearish flag pattern emerged as a reliable indicator for identifying potential downturns.
4. Characteristics of Bearish Flag Chart Pattern:
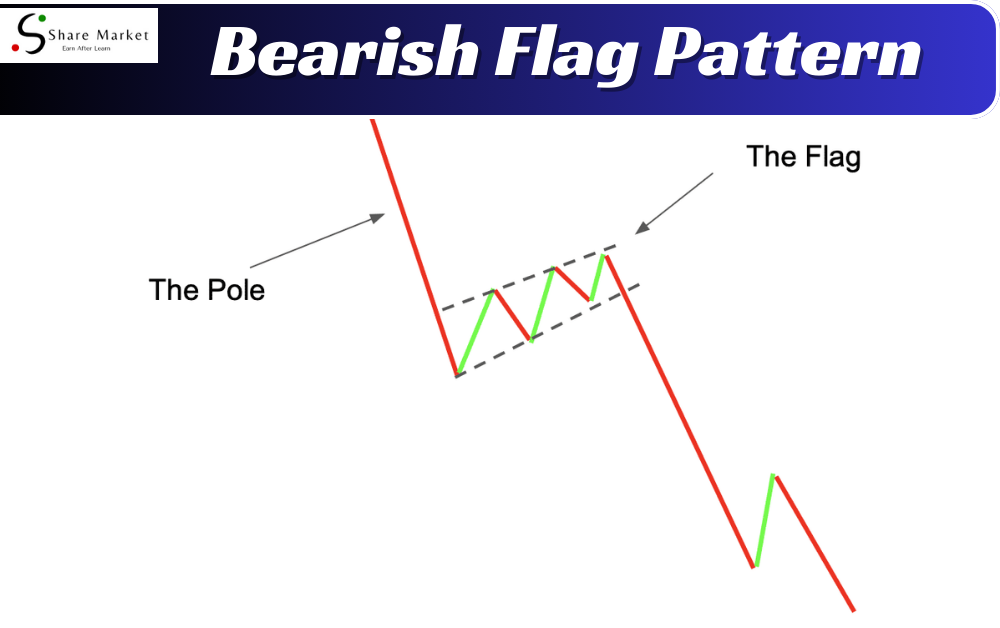
Understanding the characteristics of the bearish flag pattern is crucial for accurate identification. This pattern typically consists of two main components – a sharp, downward price movement (flagpole) followed by a rectangular consolidation (flag). The flag is inclined against the prevailing trend, resembling a flag fluttering in the wind.
5. How to Identify Bearish Flag Chart Pattern:
Spotting a bearish flag pattern involves a keen eye for market dynamics. Look for a strong price decline, followed by a rectangular consolidation that slopes against the prevailing trend. Volume analysis can also play a role, with a decrease in volume during the consolidation period.
6. What Does a Bearish Flag Chart Pattern Look Like?
Imagine a bearish flag pattern as a miniature flag on a price chart. The flagpole represents the initial sharp decline, while the flag itself is the consolidation phase. The pattern resembles a rectangular flag slanting in the opposite direction of the previous trend.
7. Trading Strategies :
To make the most of the bearish flag pattern, traders often employ specific strategies. Short-selling at the breakout point below the flag’s lower boundary is a common approach. Additionally, setting stop-loss orders and having a target price in mind can help manage risks.
8. How to Trade :
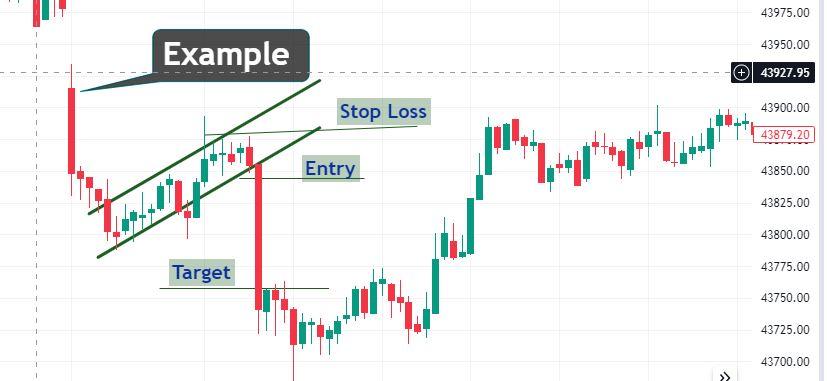
Executing a trade based on the bearish flag pattern involves careful timing. Wait for a confirmed breakout below the flag’s lower boundary before entering a short position. Monitoring volume and using technical indicators can provide additional confirmation. Here are a Image of example.
9. Tips for Using Bearish Flag Chart Pattern:
Here are some tips to enhance your use of the bearish flag pattern:
1 – Combine with other technical indicators for confirmation.
2 – Practice risk management by setting stop-loss orders.
3 – Stay updated on market news that might impact the pattern.
10. Conclusion:
In conclusion, the bearish flag pattern is a valuable tool for traders seeking to navigate the complex world of financial markets. By understanding its definition, characteristics, and trading strategies, you can incorporate this pattern into your analysis toolkit.
11. Summary :
To summarize, the bearish flag pattern is a bearish continuation signal characterized by a sharp decline followed by a rectangular consolidation. Identifying and trading this pattern involves careful analysis and strategic decision-making.
12. Importance of Bearish Flag Chart Pattern in Trading:
The bearish flag pattern holds significance for traders as it provides insights into potential price movements. Recognizing this pattern early can aid in making informed decisions and capitalizing on market trends.
13. FAQs:
What is a Bearish Flag Pattern?
The bearish flag Chart pattern is a technical analysis tool indicating a potential downward price continuation. It consists of a sharp decline (flagpole) followed by a rectangular consolidation (flag).
How to Identify a Bearish Flag Chart Pattern?
Identify a bearish flag Chart pattern by spotting a sharp price decline followed by a rectangular consolidation that slopes against the prevailing trend. Volume analysis can provide additional confirmation.
What Does a Bearish Flag Chart Pattern Look Like?
Visualize a bearish flag Chart pattern as a miniature flag on a price chart. The flagpole represents the initial sharp decline, and the flag is a rectangular consolidation sloping against the trend.
How to Trade a Bearish Flag Pattern?
Trade a bearish flag pattern by short-selling at the breakout point below the flag’s lower boundary. Use stop-loss orders and have a target price in mind for risk management.
What are the Pros and Cons of the Bearish Flag Pattern?
Pros include its reliability as a bearish continuation signal. However, cons may arise from false signals, emphasizing the importance of using the pattern in conjunction with other indicators.
In conclusion, mastering the bearish flag pattern can empower traders to make more informed decisions and navigate the dynamic world of financial markets with confidence. Happy trading!
I hope that after reading this article, you have gained a lot of knowledge. If you want to learn more about trading, you can visit this website (www.sharemarketdo.com) and learn for free