
Table of Contents
1. Introduction
The Hanging Man Candlestick is like a little sign in the world of trading, telling us interesting stories about the market. Imagine it as a signal flag waving to catch your attention. This blog will help you understand what exactly this Hanging Man is.
1.1. Definition of Hanging Man Candlestick:
Simply put, it’s a special shape on a trading chart that looks like a person hanging upside down. Don’t worry; it’s not as grim as it sounds! But spotting this shape can give traders a hint about what might happen next in the market.
1.2. Importance of Candlestick Patterns in Trading:
Candlestick patterns, like the Hanging Man, act like secret codes for traders. They help us predict where the market might be headed. It’s like having a map in the wild world of finance. By the end of this blog, you’ll be equipped with the knowledge to read this map and make smarter decisions in your trading journey.
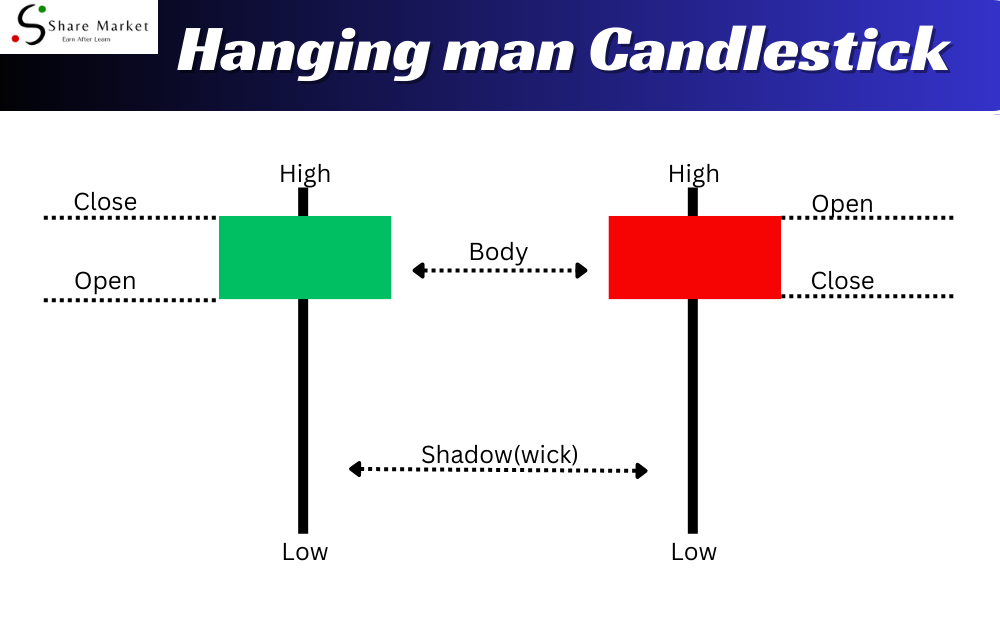
2. Anatomy of a Hanging Man
The Hanging Man candlestick is a crucial figure in trading charts, resembling a tiny person hanging by their neck. Understanding its anatomy involves recognizing key features and components that signal potential market shifts.
2.1. Description of the Hanging Man Shape:
The Hanging Man looks like a candlestick with a small body at the top and a long lower shadow, resembling a ‘T’ or an inverted ‘L’. The small body represents the opening and closing prices, while the long lower shadow indicates a significant price drop during the trading period.
2.2. Key Features and Components:
a. Small Body:
The top part of the candlestick has a small body, usually colored differently from the rest, showcasing the opening and closing prices.
b. Long Lower Shadow:
Below the small body, there’s a long line extending downwards, reflecting the lowest price reached during the trading period.
Recognizing these features helps traders interpret market sentiment, potentially predicting a reversal in price trends.
3. Identification and Recognition
Understanding how to spot a Hanging Man candlestick is crucial for successful trading. Here’s a simple guide on recognizing this pattern in market charts.
3.1. How to Spot a Hanging Man Candlestick:
Look for a single candlestick with a small body near the top of an upward trend. The candlestick should have a long lower shadow (wick) and little to no upper shadow. The small body represents a narrow trading range between the open and close, while the long lower shadow suggests that sellers pushed prices significantly lower during the session.
3.2. Recognizing Patterns in Market Charts:
When scanning charts, focus on isolated candlesticks resembling a Hanging Man. Consider the preceding trend – a Hanging Man after an uptrend indicates a potential reversal. Pay attention to the context, as individual candlesticks gain significance in relation to the overall market trend. This skill helps you make informed decisions based on Hanging Man signals, enhancing your ability to navigate the dynamic nature of financial markets.
4. Significance of the Hanging Man
The Hanging Man Candlestick holds special meaning in the world of trading. It acts like a little messenger, providing insights into the mood of the market. When you spot a Hanging Man on a price chart, it’s like a signal from the market saying, “Pay attention!”
4.1. Interpretation of the Hanging Man Candlestick:
The Hanging Man looks like a little person hanging from a rope, and its appearance after an uptrend suggests a potential trend reversal. It’s like the market taking a pause, contemplating its next move.
4.2. What it Indicates about Market Sentiment:
This candlestick reflects a battle between buyers and sellers, and the Hanging Man signals that sellers are gaining strength. It’s like a caution sign, suggesting that the optimism of the uptrend might be waning, and a shift could be on the horizon.
5. Common Mistakes to Avoid
New traders often make mistakes when dealing with Hanging Man candlesticks. One common error is misinterpreting their signals. It’s crucial to understand that a Hanging Man doesn’t always mean a trend reversal. This leads us to another pitfall – false signals. Traders sometimes act too hastily, assuming the Hanging Man guarantees a specific outcome. However, it’s essential to consider other factors and use additional indicators for confirmation. Avoiding these mistakes requires patience and a comprehensive understanding of market dynamics. Always double-check your analysis and be cautious when relying solely on Hanging Man signals to make trading decisions.
6. Using Hanging Man in Trading Strategies
Incorporating the Hanging Man candlestick into your trading plans can enhance decision-making. Look for this pattern when analyzing charts as it often signals a potential trend reversal. By identifying Hanging Man patterns, traders can make informed choices about buying or selling.
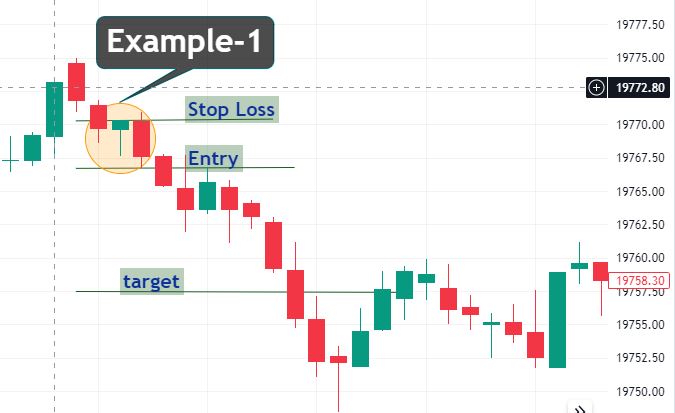
6.1. Examples of Successful Trades Based on Hanging Man Signals
Observing past market movements, you’ll find instances where recognizing the Hanging Man led to successful trades. Understanding when to act on this signal and how it aligns with market conditions is crucial. These examples showcase the practical application of the Hanging Man candlestick in real-world trading scenarios, demonstrating its value in forming effective strategies.
7. Risk Management with Hanging Man
In trading, managing risks is like steering a ship through uncertain waters. The Hanging Man candlestick, a helpful guide, signals potential changes. Yet, it’s crucial to balance its insights with caution.
7.1. Balancing Act:
To avoid missteps, balance Hanging Man observations with other indicators. Don’t rely solely on one signal.
7.2. Setting Sail Safely:
Like a compass, set clear directions with Stop Loss and Take Profit levels. If the wind changes, your plan helps navigate storms.
8. Other Candlestick Patterns
In addition to the Hanging Man, there are various candlestick patterns to understand in trading. These patterns provide insights into market movements. A brief overview of related candlestick patterns helps traders make informed decisions. It’s crucial to contrast the Hanging Man with similar patterns like the Hammer and Shooting Star. While they may look alike, their meanings differ. Recognizing these distinctions enhances a trader’s ability to accurately interpret signals and make strategic moves in the market. Understanding the broader spectrum of candlestick patterns empowers traders with a diverse toolkit for effective decision-making.
9. Practical Tips for Traders
Understanding how to apply the Hanging Man candlestick in real-world trading scenarios is crucial for success. Here’s a quick guide:
9.1. Real-world Application of Hanging Man in Trading:
Look for Hanging Man patterns in conjunction with other indicators to confirm signals. Use them as entry points for selling or tightening stop-loss orders.
9.2. Learning from Experienced Traders:
Follow seasoned traders who share insights on Hanging Man strategies. Observe their decision-making process and adapt it to your own style. Engaging with trading communities and forums can provide valuable tips and enhance your understanding of using Hanging Man candlesticks effectively.
10. FAQs about Hanging Man Candlestick
10.1. What is a Hanging Man Candlestick?
The Hanging Man is a candlestick pattern used in trading to predict potential market reversals. It looks like a hanging man with a small body and a long lower shadow.
10.2. How do I Identify a Hanging Man?
Look for a small body with a long lower shadow, appearing after an uptrend. It suggests a possible shift from bullish to bearish market sentiment.
10.3. What does a Hanging Man Indicate?
The Hanging Man signals uncertainty. It implies that sellers might be gaining strength, and a trend reversal could be on the horizon.
10.4. Can Hanging Man Patterns be Mistaken?
Yes, false signals are possible. It’s essential to consider other factors and use confirmation before making trading decisions.
10.5. How to Use Hanging Man in Trading?
Incorporate it into your strategy cautiously. Combine it with other indicators and practice risk management for effective trading.
11. Conclusion:
In wrapping up, the Hanging Man candlestick serves as a valuable tool in understanding market trends. Keep an eye on this little figure; it may reveal more than you think. Embrace the insights it offers, and may your trading journey be illuminated by the wisdom of the Hanging Man.
I hope that after reading this article, you have gained a lot of knowledge. If you want to learn more about trading, you can visit this website (www.sharemarketdo.com) and learn for free.